
What is ZynIQ?
ZynIQ is an integrated trading intelligence ecosystem designed to give traders clarity, automation and confidence. It combines precision TradingView indicators, a stability-first crypto trading bot and a clean dashboard UI that all work together as one stack.
The philosophy behind ZynIQ is simple: stability first, intelligence second. Indicators provide structure on the chart, the bot executes with discipline and self-learning, and the dashboard gives full visibility into what is happening and why.
The three pillars of ZynIQ
1. Precision indicators (TradingView)
ZynIQ indicators focus on structure instead of noise: breakout detection, market regime awareness, volatility filters, ATR-based risk tools and utility overlays.
2. ZynIQ bot (self-learning, early access)
The ZynIQ bot is an autonomous trading engine built around safety, consistency, transparency and self-learning behaviour from launch. It uses its own internal scoring, filters and risk model rather than simply mirroring indicator signals.
3. Dashboard (demo mode to live)
The dashboard is the interface layer for the bot. In demo mode it lets you explore how the bot behaves using simulated data. As live trading support is introduced, the same dashboard will be used to monitor and manage real accounts.
Mission and current state
ZynIQ aims to remove noise, reduce complexity and avoid black-box behaviour. It is built for traders who want structured, rule-based clarity rather than hype or guesswork.
Today, indicators are available on TradingView, the dashboard runs in demo mode and the bot is progressing through a controlled early access phase.
Getting started
1. Start with the indicators (TradingView)
ZynIQ indicators introduce you to how ZynIQ reads the market, but they are not the same as the bot's internal decision engine. They help you understand market structure, breakout zones, volatility behaviour, trend context, ATR-based risk views and market regimes.
The bot uses a deeper internal model including multi-layer safety filters, volatility and regime checks, execution timing intelligence, risk context awareness, symbol-specific behaviour and self-learning logic from launch. Indicators teach the market; the bot decides when to trade.
2. Explore the ZynIQ dashboard (demo mode)
The dashboard is the control centre of ZynIQ. In demo mode you can safely explore bots, open and closed trades, PnL, symbol snapshots, performance views and the activity timeline using simulated data.
This reflects how the bot behaves, not how indicators behave. The bot applies adaptive scoring, safety layers and self-learning components that are not visible on TradingView charts.
3. Understand the ZynIQ workflow
Most users follow this natural progression:
- Step 1 – Learn structure (indicators): understand breakout, context, trend and volatility principles.
- Step 2 – Explore automation (dashboard): learn how the bot interprets market conditions with advanced logic.
- Step 3 – Move into early access or live mode: when live trading is available, you already know the system.
4. What you need (and do not need)
You do not need: Python, servers, JSON configs, a VPS, coding skills, terminals or back-end setup. ZynIQ handles all of this internally.
You will need: a TradingView account for indicators, a ZynIQ account for the dashboard and an exchange account only when live trading launches.
5. Why ZynIQ is easy to start with
ZynIQ removes three major barriers: complexity (no configs or servers), confusion (transparent behaviour instead of black boxes) and risk (demo mode lets you explore with zero financial exposure).
6. Next steps
Once you have learned the indicators and explored demo mode, the natural next step is joining the early access waitlist and preparing for your first live ZynIQ bot when launch arrives.
Indicator overview
Breakout indicators
- Breakout Essentials
- Breakout Lite
- Breakout Pro
- Breakout Pro Plus
Regime & context indicators
- Market Regime Master
- Trend & volatility state tools
- Compression / expansion context tools
Risk & utility indicators
- Built‑in ATR stop/target ladder
- HUD / information overlays
- Trend filters
This section serves as a high-level map of all indicators in the ZynIQ suite. Each category has its own detailed documentation page accessible from the sidebar.
Putting it all together: example workflows
Once you understand what each indicator does, the next step is to combine them into a simple, repeatable workflow. The goal is not to turn every tool on at once, but to build a clear decision process that fits how actively you trade.
Essentials workflow – learning the system
Use when you are new to ZynIQ or prefer a simple, low-clutter chart.
- Pick a timeframe – for most users, 5m or 15m on a liquid FX pair, index or crypto pair is ideal.
- Enable Breakout Essentials with the Risk Helper – keep other overlays off at first.
- Mark higher timeframe bias – quickly check a higher timeframe (for example 1H) and note whether structure is broadly bullish or bearish.
- Only act in the direction of that bias – if higher timeframe is bullish, focus on LONG breakout signals; if bearish, focus on SHORTs.
- Use the ladder as a plan – before entering, decide how you will behave at SL, TP1 and TP2.
- Journal a small sample – take screenshots of a handful of trades and note what the indicator did vs what price did next.
Lite intraday workflow – sessions and context
Use when you are comfortable with the basics and want better intraday context.
- Turn on the Lite pack – Breakout Lite, Session Master, Premium / Discount, VWAP and Volume Surge Lite.
- Start with one main session – for example, only trade London or New York until you understand that session's personality.
- Filter trades by area – bias longs from discount zones and shorts from premium zones, within your chosen session.
- Check volume – only act on breakouts that occur with at least normal or elevated volume; ignore "dead" moves.
- Use VWAP as a sanity check – avoid chasing price far away from VWAP unless volatility and regime strongly support it.
Pro workflow – structured intraday or swing trading
Use when you want the full Pro environment but still want a clear, step-by-step process.
- Define your main timeframe – for intraday, often 5m or 15m; for swing, 1H or 4H.
- Enable core Pro tools – Breakout Pro, Market Structure Master, Liquidity Master, FVG Master, Trend Master and Volume Surge Pro.
- Read structure first – identify whether the structure is clearly bullish, clearly bearish, or messy/choppy. Stand aside in obvious chop.
- Locate key areas – use liquidity pools, FVGs and structure levels to decide where you actually want to do business.
- Wait for alignment – take trades when breakout direction, structure bias and trend cloud all agree, with supportive volume.
- Let volatility inform expectations – in quiet regimes, aim for nearer targets; in healthy expansion, you can allow trades to breathe more.
Pro Plus workflow – full environment trading
Use when you are already comfortable with Pro and want to incorporate the full Pro Plus suite.
- Start from your Pro workflow – keep the same base timeframe and structure/liquidity reading process.
- Add Regime Master Pro and Volatility Master – use them as high-level filters, not as entry triggers.
- Use Breakout Core Pro Suite for signal quality – treat its grading and displacement awareness as an extra check on breakout quality.
- Integrate Order Block Master where it makes sense – focus on OBs that align with higher timeframe structure, FVGs and liquidity.
- Keep charts readable – only enable HUDs and overlays you can actually interpret in real time; more is not always better.
- Review regularly – periodically hide some tools and check that you can still tell the same story about the market. Tools should clarify your thinking, not replace it.
If you ever feel lost, go back to the simplest workflow that still makes sense for you (often the Essentials or Lite flow), and only add complexity once you are consistently comfortable again.
Breakout suite
Shared concepts
All ZynIQ breakout editions are built on the same structured breakout logic. The engine looks for price building a clear range, then breaking with intent. It uses body-based ranges, candle ranges, minimum distance filters and optional volatility and volume filters so that signals only appear when there is a meaningful move.
At a high level, every edition answers three questions:
- Where is structure? – recent highs/lows and range boundaries.
- Has price actually broken? – not just a wick poke, but a proper break.
- Is this move worth taking? – filters to avoid weak or noisy breaks.
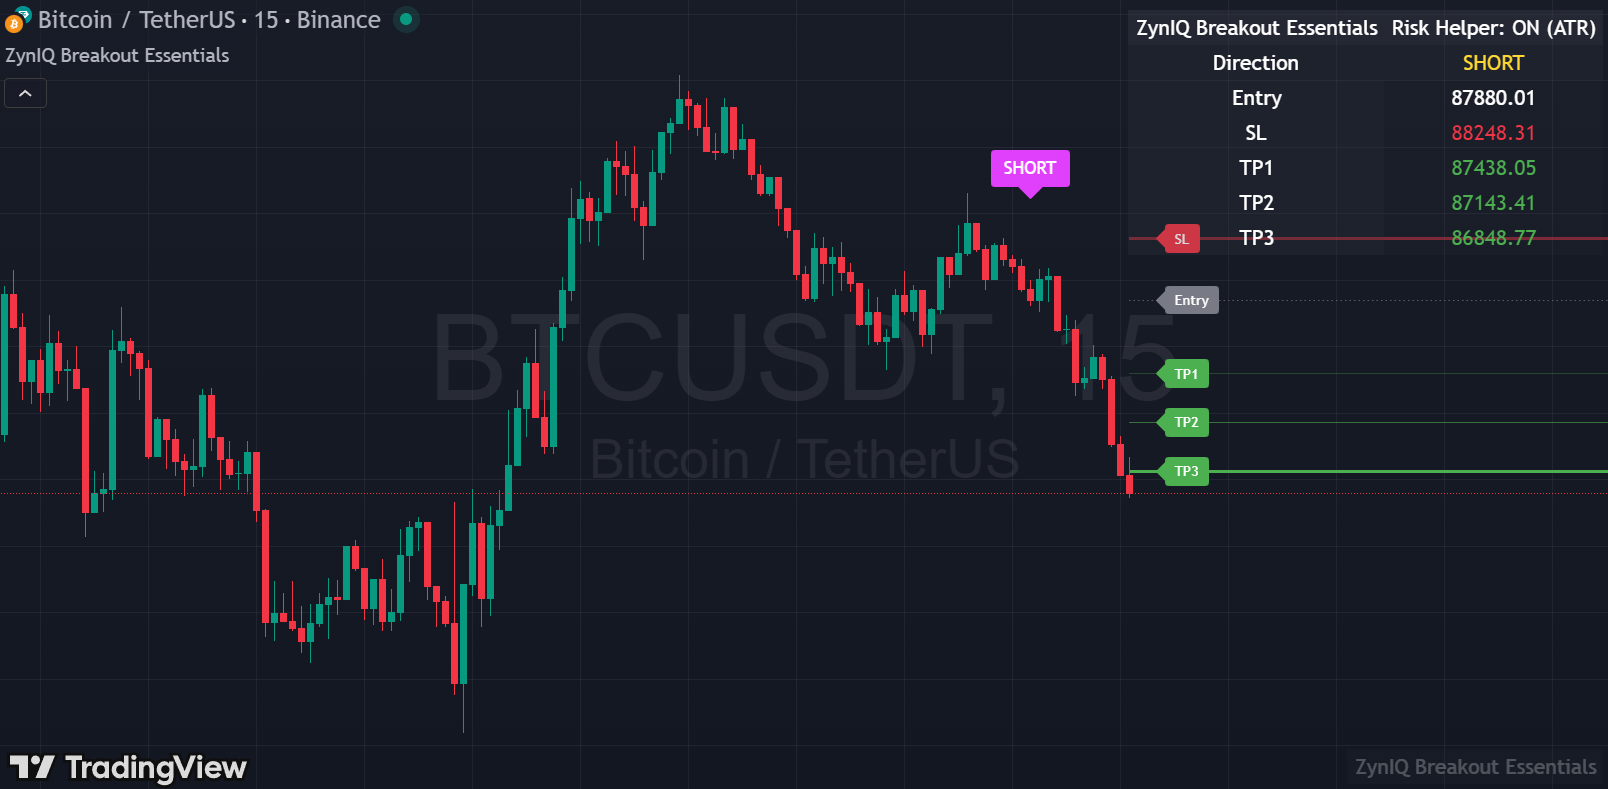
Breakout Essentials
Best for: traders who want a clean, minimal breakout view to learn the system and build confidence.
Essentials is the simplest form of the breakout engine. It focuses on clean LONG/SHORT markers with a small number of inputs and a gentle risk ladder. You get a clear sense of where price is breaking out without being overwhelmed by options.
How it plots on your chart
- Range box drawn around recent structure.
- LONG / SHORT labels printed when price breaks with enough distance.
- Optional SL / TP1 / TP2 / TP3 ladder based on ATR or simple percentage moves.
Recommended timeframes
- Intraday: 5m, 15m.
- Swing: 1H, 4H.
- Avoid very low timeframes (e.g. 1m) until you are comfortable, as noise is much higher.
Key settings
- Breakout range length – how many candles to include in the box. Smaller values = more signals, larger values = fewer but stronger structural breaks.
- Minimum candle size / distance – prevents tiny breakouts that do not really leave the range.
- SL/TP mode – percentage-based for simple setups, ATR-based for volatility-aware setups.
How to use it
- Use Essentials to learn where ZynIQ considers structure and valid breaks.
- Focus on trades where the breakout aligns with your higher timeframe bias.
- Avoid taking every single signal; use it as a map, not a “must trade” alert.
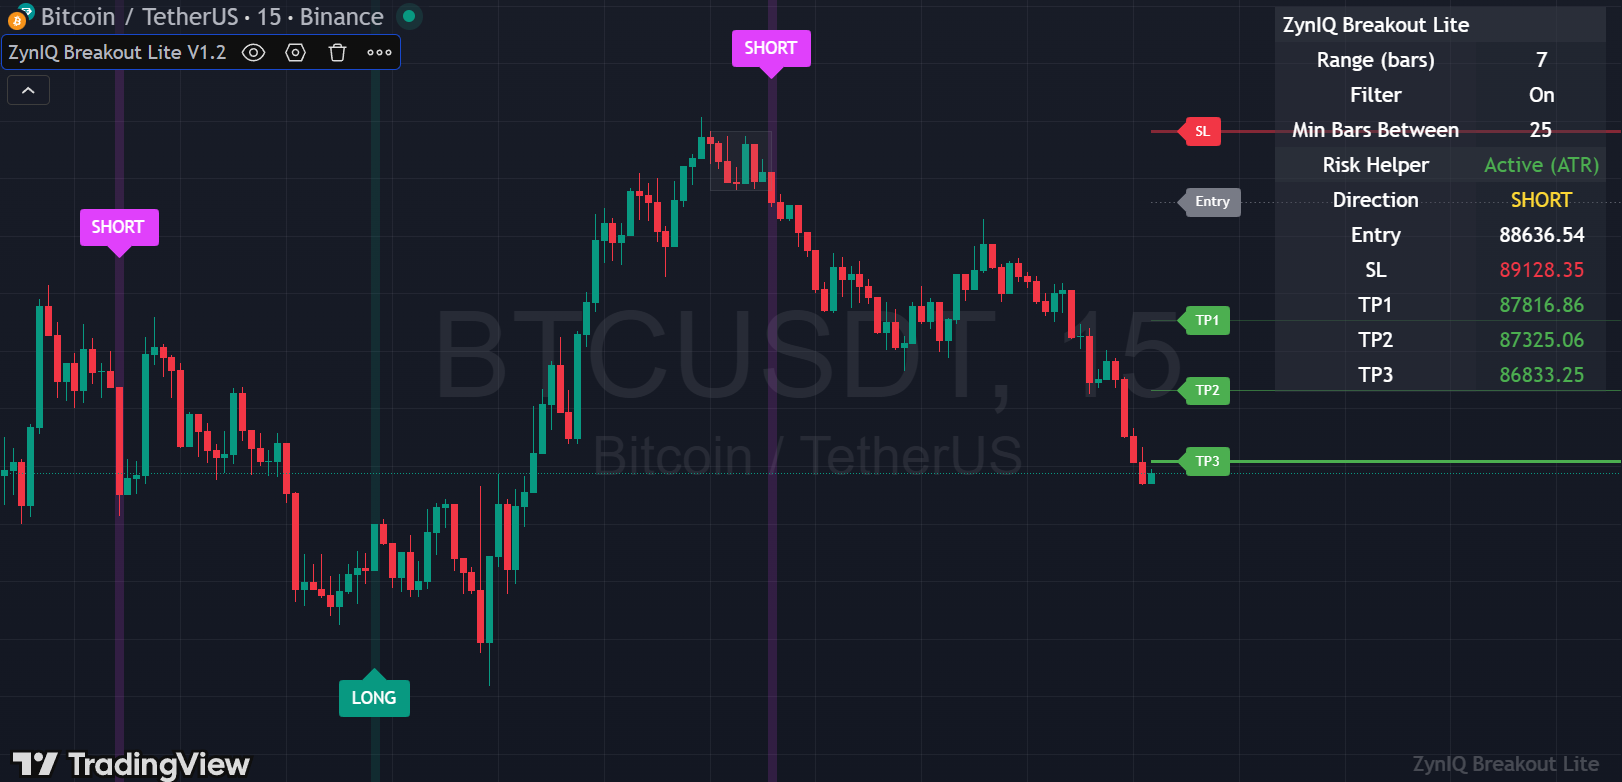
Breakout Lite
Best for: traders who want more control, integration with the Lite environment and a slightly richer HUD.
Breakout Lite builds on Essentials by adding extra controls and integration with the Lite pack (sessions, premium/discount zones, VWAP and volume context). The logic is still simple and visual first, but Lite gives you more options to tune how often signals appear.
What Lite adds vs Essentials
- More filters to ignore tiny or mid-range breakouts.
- Optional session and premium/discount awareness, so you can focus on breaks in the best areas.
- Tighter control over how far price must travel beyond the range to count as a break.
Recommended timeframes
- Intraday scalping: 1m, 3m, 5m.
- Intraday swings: 15m, 30m.
Practical usage tips
- Use Lite when you want the chart to also show sessions and premium/discount zones.
- Combine Lite with the Lite volume and momentum tools to see whether a breakout has real participation.
- If the chart feels busy, start with fewer overlays (sessions only) and add more once you are comfortable.
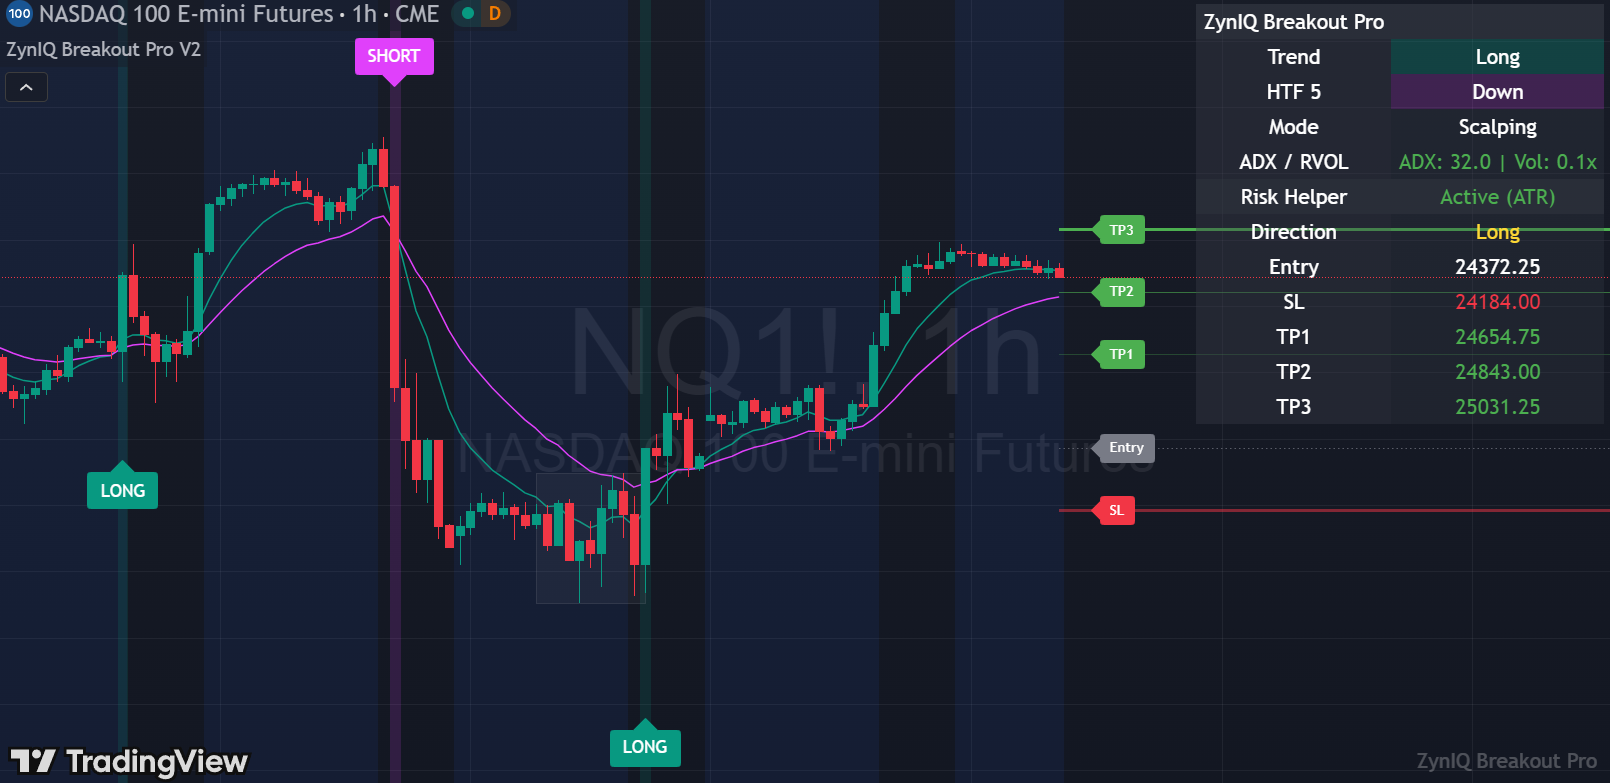
Breakout Pro
Best for: active intraday traders who want more filtering, profiles and a full risk ladder.
Breakout Pro is the main breakout engine inside the Pro pack. It adds profile-based behaviour (Scalping / Intraday / Swing), more aggressive filtering and a fully featured SL/TP ladder with ATR-aware levels. It is designed to be the “workhorse” edition for serious use.
What Pro adds vs Lite
- Trading profiles that change how strict the engine is.
- Optional ADX / volatility filters to cut out flat conditions.
- Richer risk ladder with clearly labelled TP levels and stops.
Recommended timeframes
- Scalping profile: 1m–5m.
- Intraday profile: 5m–15m.
- Swing profile: 1H–4H.
How to work with signals
- Start by using Pro in “Intraday” profile on 5m or 15m charts.
- Only take trades in the direction of your higher timeframe bias and trend tools.
- Use the risk ladder as a plan: pre-decide how you will manage around TP1/TP2/TP3.
Breakout Pro Plus (Breakout Core Pro Suite)
Best for: advanced users who want deeper context, displacement grading and integration with the full Pro Plus stack.
Breakout Pro Plus (implemented as the Breakout Core Pro Suite) is the highest tier breakout engine. It layers in displacement strength, volatility state and richer continuation vs exhaustion logic. It is designed to be used together with the full Pro Plus environment (regime, volatility and structure suites).
What Pro Plus adds vs Pro
- Displacement-aware grading of breakout quality.
- Tighter integration with volatility and regime tools.
- Additional internal states to help distinguish clean continuation vs likely fakeouts.
Usage guidelines
- Use Pro Plus once you are already comfortable with Pro and the broader ZynIQ environment.
- Avoid enabling every overlay at once; keep charts readable and only show what you actually use.
- Use Pro Plus signals together with structure, liquidity and volatility suites rather than in isolation.
Alerts & general usage
All breakout editions support TradingView alerts. In general, it is better to configure a small set of clear alerts (for example, only high-quality breakout conditions) rather than alerting on every single internal event.
Remember that indicators are there to explain structure and context. Execution and automation are handled by the ZynIQ bot and your own decision process, not by chasing every marker on the chart.
Structure & liquidity tools
Market Structure Master V2
Best for: traders who want a clear, automated map of swing structure, BOS/CHOCH events and structural bias.
Overview
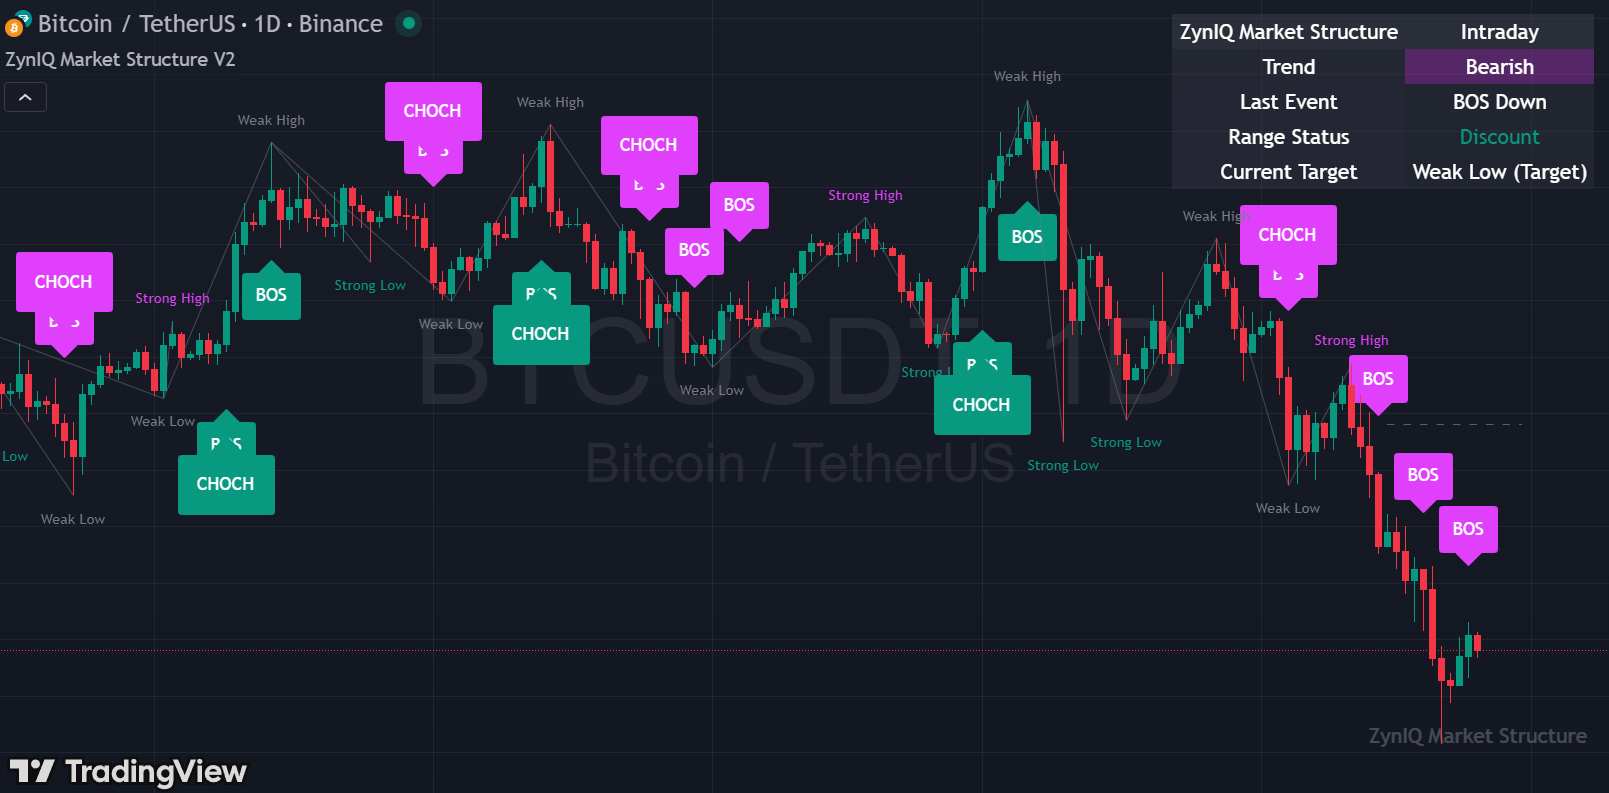
Market Structure Master V2 tracks swing highs and lows and marks when structure breaks in a meaningful way. It is designed to answer questions such as "Are we in a bullish or bearish structure?" and "Has that structure just broken?" without you having to manually mark every leg.
How it plots
- Annotated swing highs and lows connected by structure lines.
- BOS (Break of Structure) and CHOCH (Change of Character) labels when key levels are taken.
- Optional EQ (equilibrium) line and premium/discount helper around recent structure.
Recommended timeframes
- Intraday context: 5m, 15m.
- Swing context: 1H, 4H.
- Use one timeframe higher than your entry chart to avoid over-focusing on very small swings.
Key settings
- Swing sensitivity – how large a move must be to count as a swing. Higher values = fewer, more meaningful swings.
- Minimum distance between events – prevents BOS/CHOCH labels from stacking on top of each other.
- Label / line visibility – control how busy the chart becomes, especially on lower timeframes.
How to use it
- Use the current structural bias (bullish vs bearish) to align breakout and OB trades with the main leg.
- After a CHOCH, be cautious: the market may be shifting from one regime to another or entering a deeper retrace.
- Avoid trading against a series of strong BOS events unless you are intentionally fading extremes.
Liquidity Master V2
Best for: traders who want to see where stop clusters and liquidity pools are likely to sit above and below price.
Overview
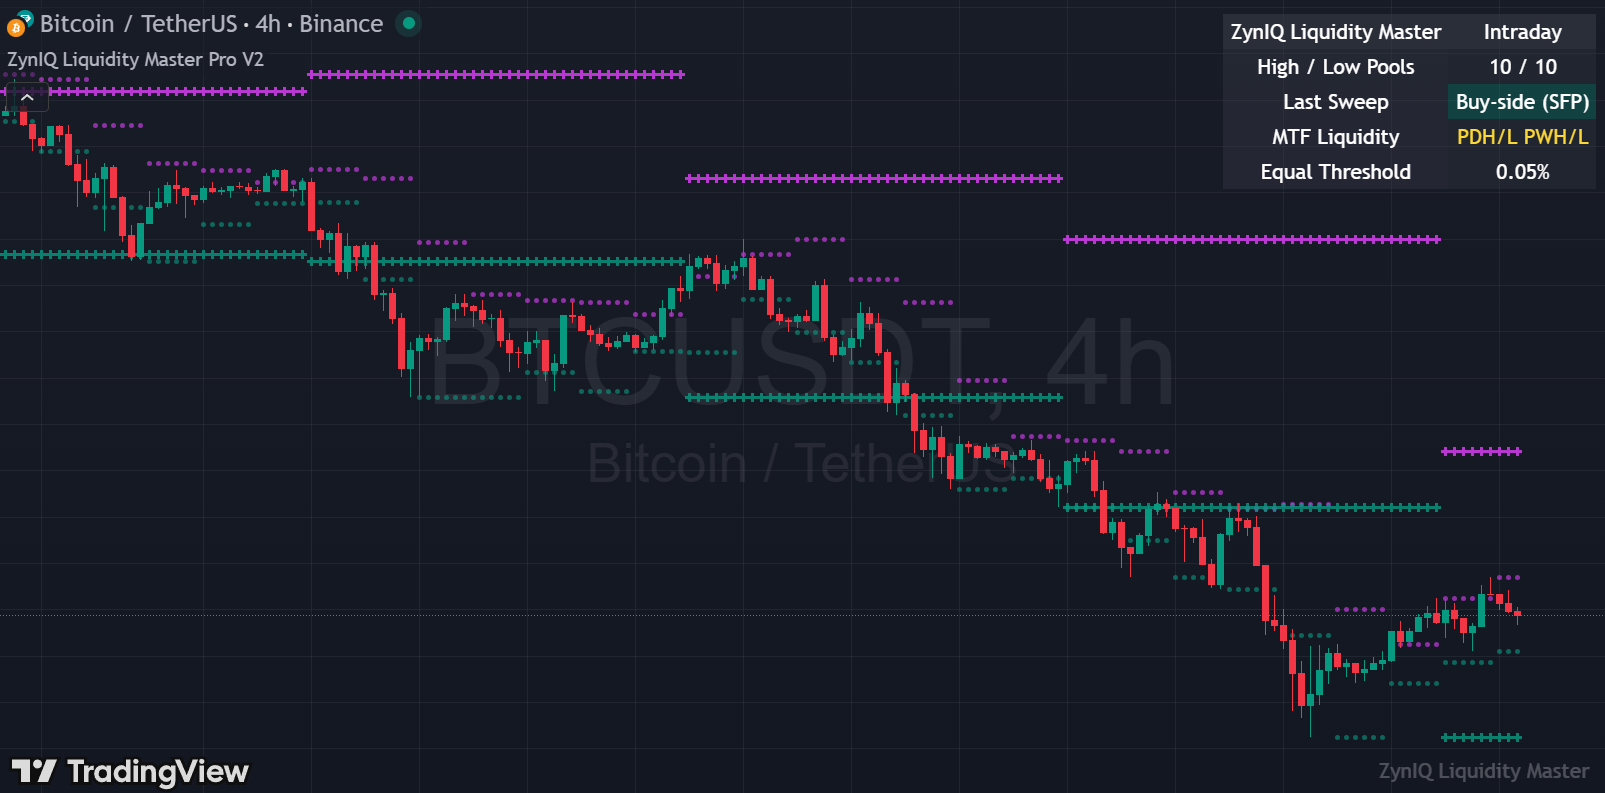
Liquidity Master V2 highlights areas where liquidity is likely to be resting: equal highs and lows, prior highs/lows, and key swing areas. It is designed to help you see where large players might hunt stops before reversing price.
How it plots
- Equal-high and equal-low liquidity pools above and below price.
- Previous day/week highs and lows (PDH/PDL/PWH/PWL) where liquidity often builds.
- Marks or highlights when these pools are swept.
Recommended timeframes
- Intraday: 5m–15m for local pools.
- Higher timeframes (1H, 4H) for major swing liquidity.
How to use it
- Avoid chasing trades directly into obvious liquidity pools; wait to see how price reacts around them.
- Combine liquidity sweeps with structure and FVG tools to frame reversal or continuation ideas.
- Use daily and weekly levels as "big picture" reference points for where business is likely to be done.
FVG Master V2
Best for: traders who use fair value gaps / imbalances as part of their execution model.
Overview
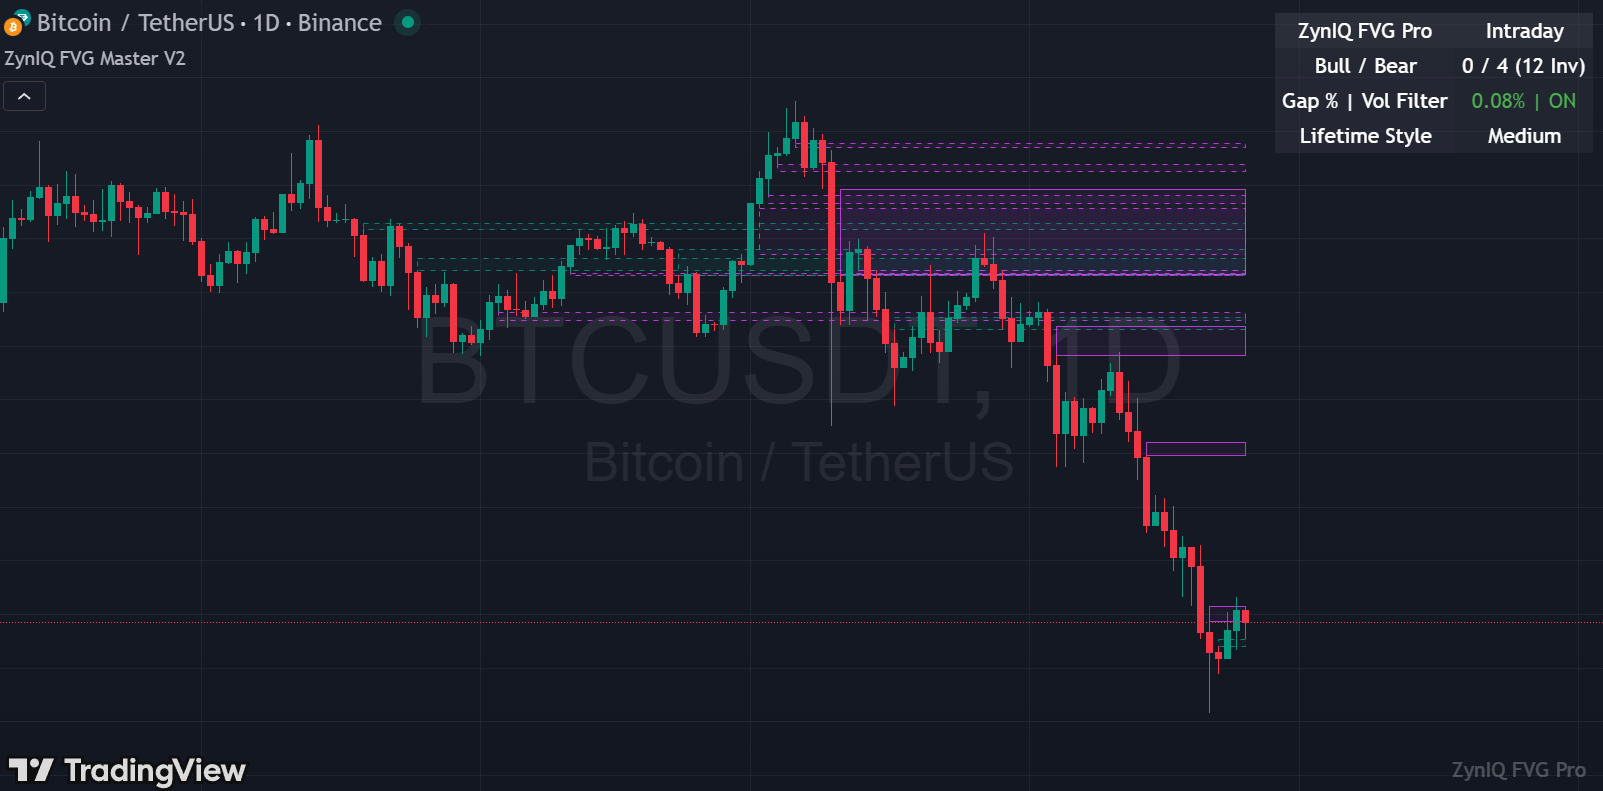
FVG Master V2 automatically detects bullish and bearish fair value gaps and tracks their lifecycle as they are created, tapped, partially filled and invalidated. It can also treat certain gaps as inversion zones once they fail.
How it plots
- Coloured zones for bullish and bearish FVGs.
- Visual distinction between fresh, mitigated and invalidated gaps.
- Optional inversion marking when a failed FVG becomes a support or resistance zone.
Key settings
- Minimum gap size – filters out tiny gaps that are not meaningful.
- Maximum age – removes very old gaps that are no longer relevant.
- Volume / displacement filters – optionally require strong moves to create a valid FVG.
How to use it
- Mark FVGs on your higher timeframe first, then fine-tune entries on your lower timeframe using the same zones.
- Combine FVGs with structure bias: look for longs into bullish FVGs in bullish structure, and shorts into bearish FVGs in bearish structure.
- Use inversion zones as areas where prior imbalance flips role; be cautious about blindly fading them.
Order Block Master V2
Best for: traders who use order blocks and SMC-style entries and want a consistent, rules-based view.
Overview
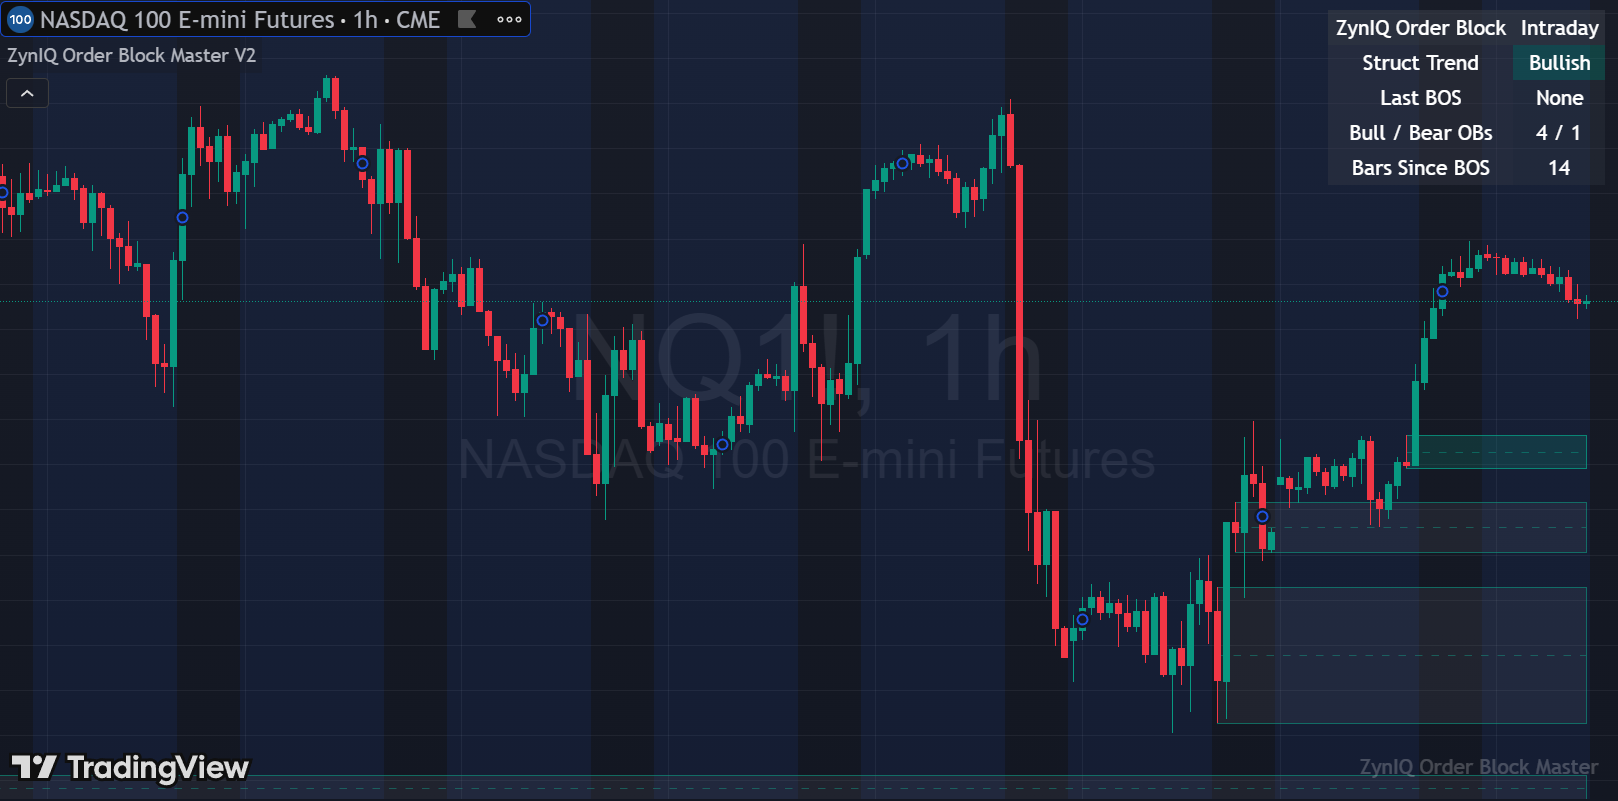
Order Block Master V2 detects candidate bullish and bearish order blocks using BOS logic, volume and displacement filters. It then tracks whether those blocks are respected, mitigated or invalidated. The aim is to provide a rules-based, visual representation of an otherwise subjective concept.
How it plots
- Highlighted bullish and bearish order block zones on your chart.
- Labels or HUD states indicating whether a block is fresh, mitigated or invalid.
- Optional confluence markers when OBs align with FVGs, liquidity pools or key structure levels.
Key settings
- Minimum impulse size – controls how strong the move away from the block must be to validate it.
- Volume / displacement validation – filters out weak, low-energy moves.
- Maximum number of active blocks – prevents the chart becoming cluttered.
How to use it
- Use order blocks in the direction of your higher timeframe structure; avoid fading strong trends with random OBs.
- Look for confluence between OBs, FVGs, liquidity pools and regime/volatility context.
- Remember that OBs are areas of interest, not guarantees; manage risk using the Risk Helper ladder and structure.
Regime tools
What is a market regime?
A regime describes the broader market environment your trades live inside. Instead of only looking at single candles, ZynIQ regime tools classify trend direction, trend strength, volatility state and momentum behaviour so you can see whether conditions are supportive or dangerous for your strategy.
Most problems traders run into (chop, fake breakouts, random reversals) are a symptom of trading the right idea in the wrong regime. The goal of these tools is to make the regime obvious enough that you naturally become more selective.
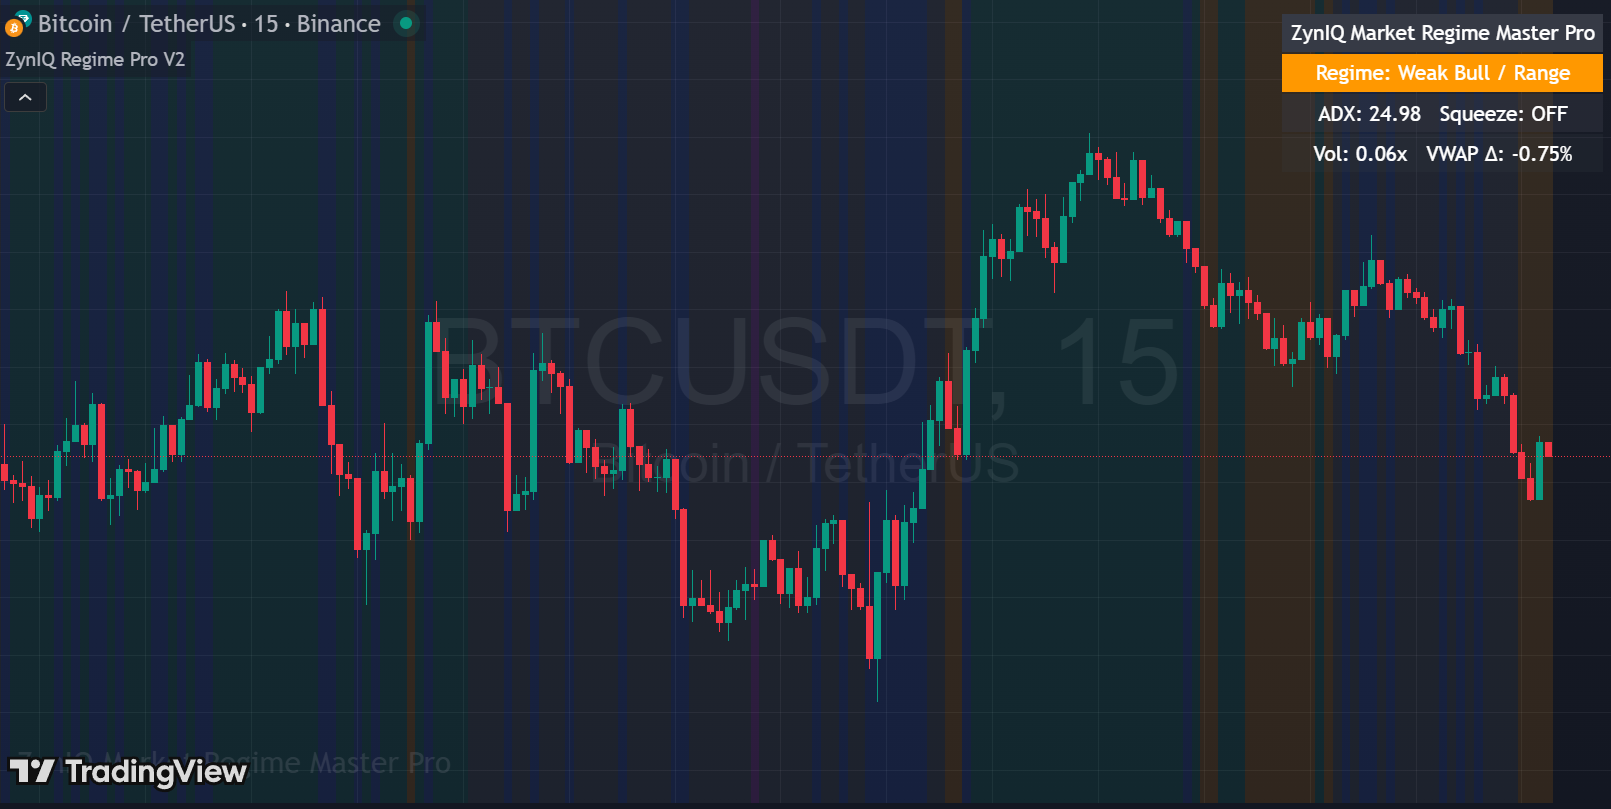
Market Regime Master Pro V2
Best for: intraday and swing traders who want institutional-style regime classification to filter entries.
Overview
Market Regime Master Pro V2 looks at price action, volatility and momentum together to assign a regime state such as Accumulation, Trend, Expansion, Distribution or Chop. It is designed to tell you when conditions are favourable for breakouts and continuation trades, and when you should expect messy back-and-forth behaviour instead.
How it plots
- A primary regime label or state in the HUD (for example: Trend Up, Trend Down, Range, Chop).
- Optional colour changes or bands indicating regime transitions.
- Sub-states for "hot" expansion conditions vs quieter sessions.
Recommended timeframes
- Intraday context: 5m, 15m.
- Swing context: 1H, 4H.
- Use the same timeframe you base your trade decisions on, then sanity-check one step higher.
Key settings
- Lookback windows – how much recent data is considered for regime shifts. Larger windows = slower, more stable regimes; smaller windows = faster but more reactive.
- Volatility sensitivity – how quickly the tool flags expansion vs compression.
- Momentum smoothing – controls how noisy the momentum component is.
How to use it
- Use Regime Master Pro as a filter: do not take breakout or trend trades when the regime is clearly "Chop" or "Range with low energy".
- Favour continuation trades when the regime shows persistent directional trend and supportive volatility.
- When the regime is shifting (e.g. from Expansion to Distribution), reduce size or wait for the new state to stabilise.
Tips & practical notes
- Think of the regime as a backdrop: if the backdrop is bad, even good setups have a harder time performing.
- Do not try to "force" trades during clearly hostile regimes; let the tool push you towards patience.
- Use regime information alongside structure and volatility tools rather than on its own.
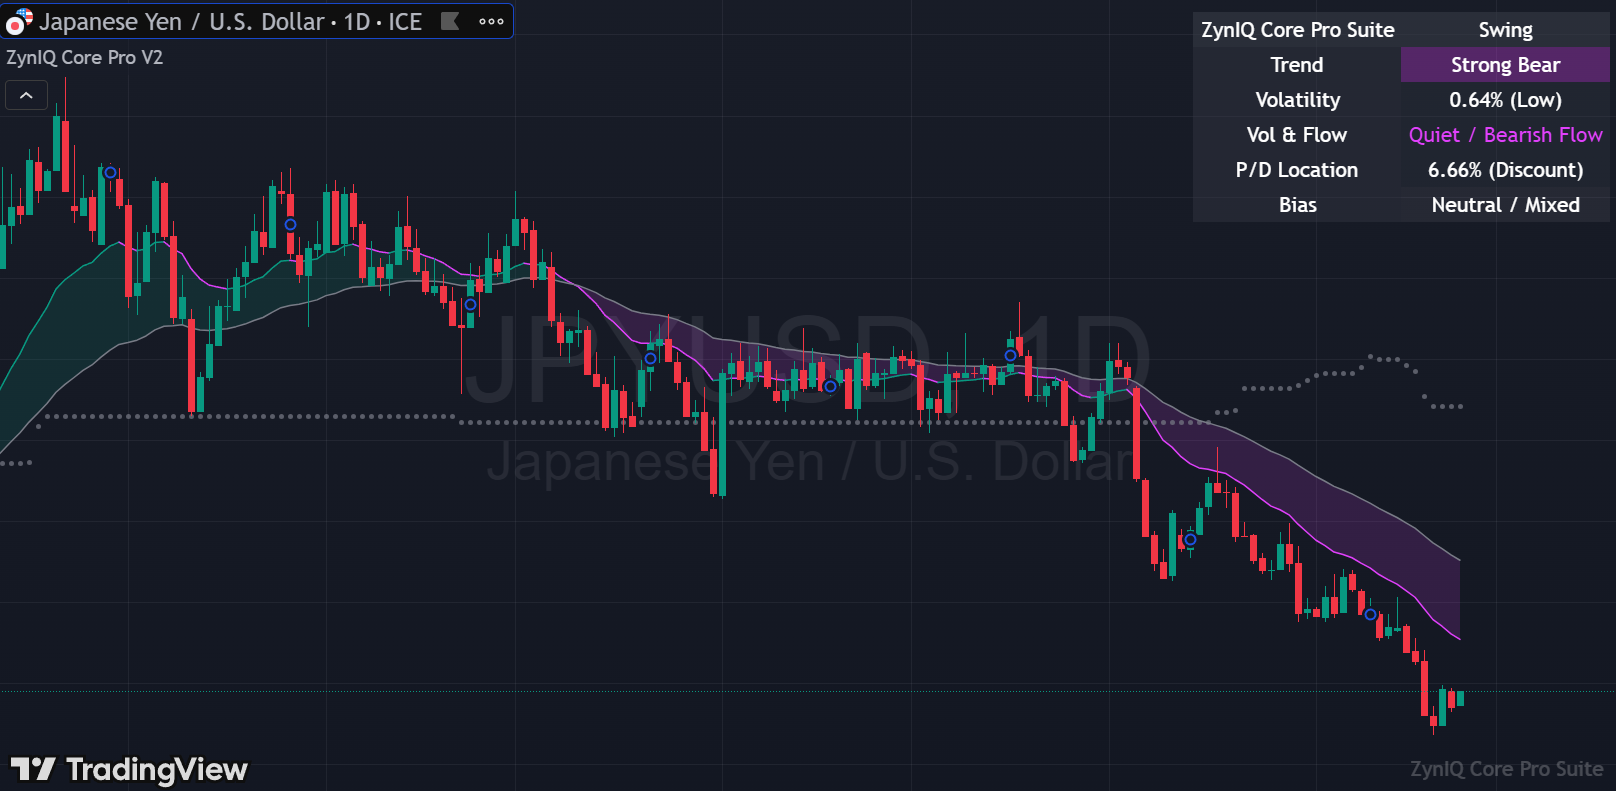
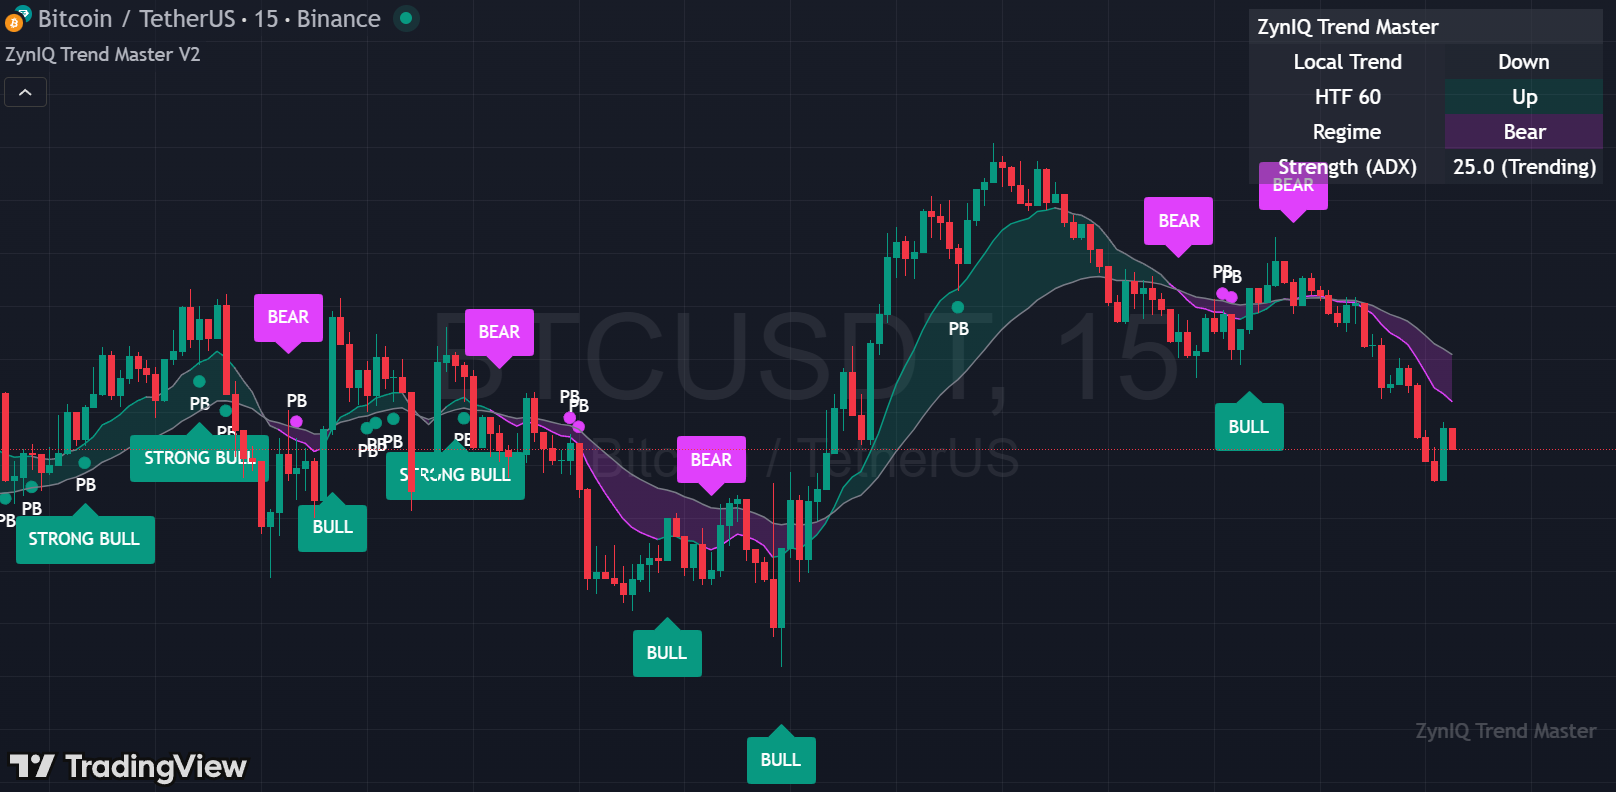
Trend Master V2
Best for: traders who want a clear, visual trend cloud and pullback structure without complex configuration.
Overview
Trend Master V2 builds a trend cloud between fast and slow EMAs and scores the direction and strength of the move. It can also highlight pullback zones inside an existing trend so you can position around the main move rather than chasing candles once they are already extended.
How it plots
- A coloured cloud between fast and slow EMAs, showing direction and basic strength.
- Optional pullback highlights inside the cloud when price returns to fair value areas.
- Trend HUD elements with "Bull" / "Bear" / "Neutral" states.
Recommended timeframes
- Intraday: 5m, 15m.
- Swing: 1H, 4H.
- Use the same timeframe as your breakout engine so both speak the same "language".
Key settings
- Fast / slow lengths – control how quickly the cloud responds to direction changes.
- Pullback sensitivity – how strict the tool is about marking pullbacks inside the trend.
- HUD options – whether to show a compact state readout or only use the visual cloud.
How to use it
- Trade in the direction of the trend cloud; avoid counter-trend breakouts unless you have a strong reason.
- Look for breakout entries that occur after a healthy pullback into the trend cloud, not after vertical runs.
- When the cloud keeps flipping direction, treat this as a warning of choppy conditions.
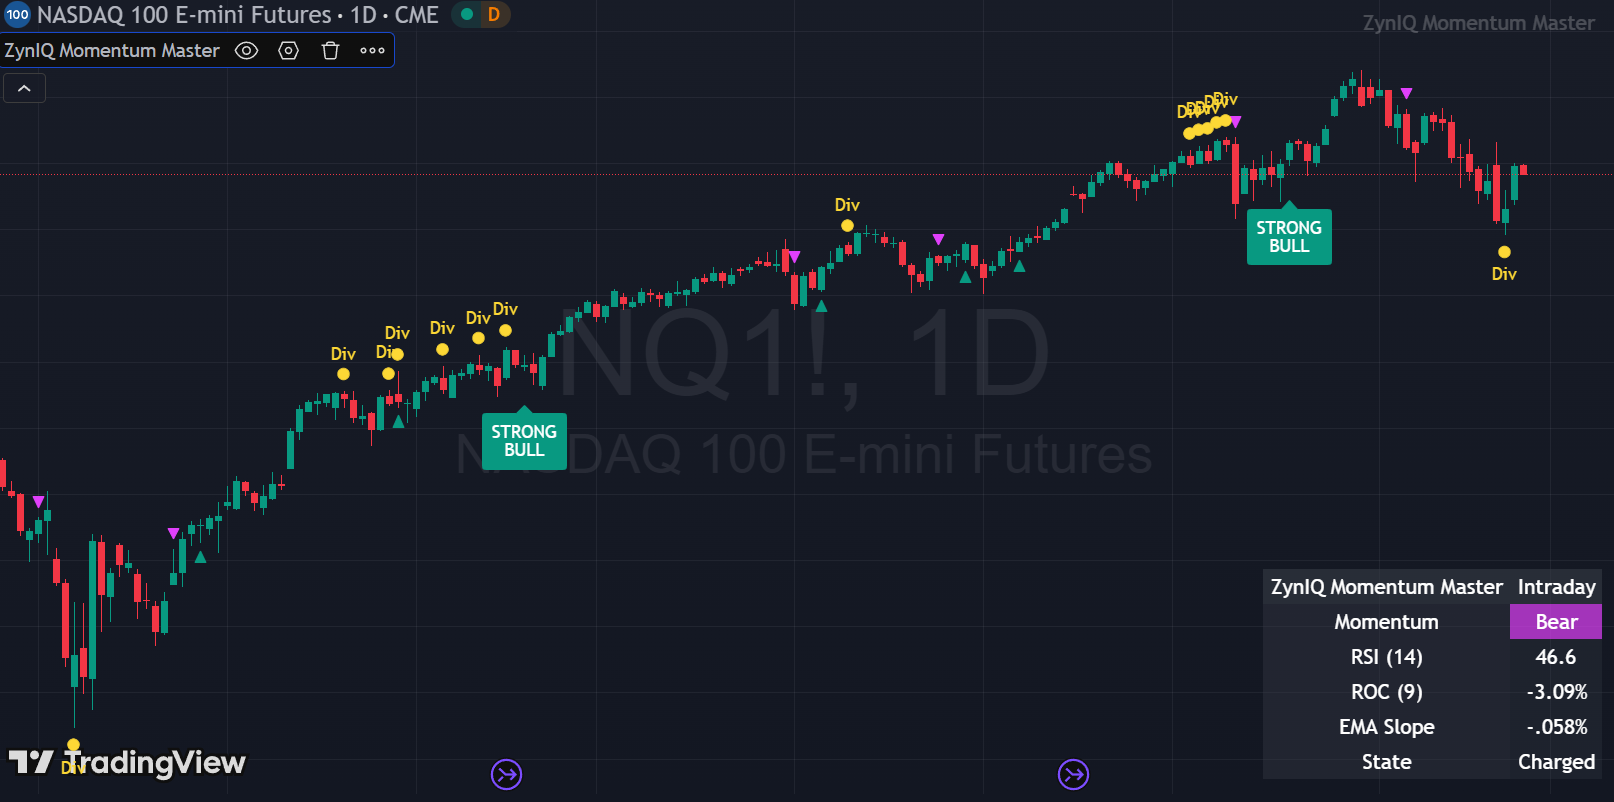
Momentum Master (Lite environment)
Best for: Lite users who want an extra read on short-term momentum without a full regime engine.
Overview
Momentum Master is a compact momentum overlay used inside the Lite environment. It blends short-term strength and directional information into a small number of states (for example: Neutral, Building, Strong Bull, Strong Bear) so you can quickly see whether a breakout has momentum behind it.
How it plots
- A HUD or on-chart state label showing current momentum state.
- Optional colour cues on the main chart when momentum flips or cools off.
Recommended timeframes
- Intraday Lite setups: 1m–15m.
- Can be used on higher timeframes, but it is primarily tuned for intraday use.
How to use it
- Avoid new longs when momentum is clearly rolling over or in a strong bear state.
- Avoid new shorts when momentum is clearly building in a strong bull state.
- Combine with session and premium/discount context to focus only on momentum shifts in your preferred areas.
Working with regime tools as a whole
Regime, trend and momentum tools are there to help you say "no" more often. Most traders already know what a good setup looks like in hindsight; the challenge is taking those setups only when the backdrop is supportive.
- Use the regime tools to decide whether you should be trading breakout continuation, mean-reversion, or standing aside.
- Let the tools nudge you towards trading only when conditions are aligned, instead of reacting to every candle.
- Pair regime information with structure and volatility tools
Risk & utility tools
Risk Helper (Essentials, Lite, Pro, Pro Plus)
Best for: all users who want a structured, visual way to think about stops and targets.
Overview
The ZynIQ Risk Helper is built into the breakout indicators. It plots a stop-loss and up to three take-profit levels based on either simple percentage moves or ATR (Average True Range). The goal is not to force you into a fixed model, but to give you a consistent visual set of "decision levels" around each trade.
How it plots
- A stop-loss line and label below a LONG entry (or above a SHORT entry).
- TP1, TP2 and TP3 levels spaced according to your chosen mode (percentage or ATR-based).
- Optional colour changes on levels that have been touched or exceeded.

Recommended settings
- ATR mode – more adaptive; levels expand and contract with volatility.
- Percentage mode – simpler; easier to reason about numerically, especially for new users.
- Number of TP levels – many traders find TP1 + TP2 is enough; TP3 can be reserved for strong trends.
How to use it
- Decide in advance how you will manage trades around the ladder (for example: scale out at TP1/TP2, trail behind structure).
- Avoid constantly changing your mind mid-trade; let the ladder act as a pre-defined plan.
- In very choppy regimes, consider using closer targets or standing aside instead of stretching for TP3.
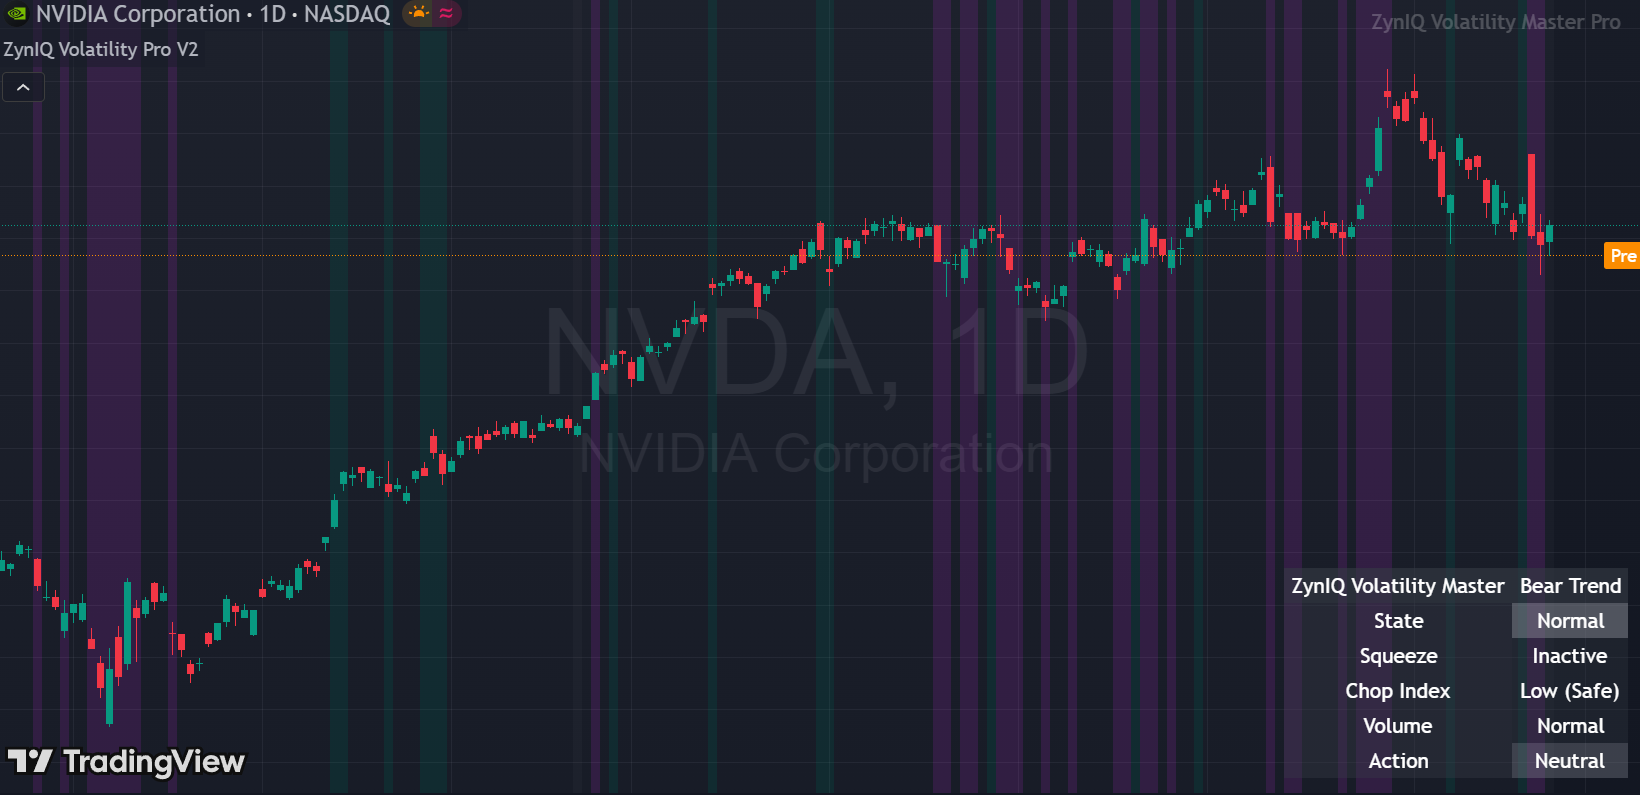
Volatility Master Pro V2
Best for: traders who want to see when the market is quiet, compressing, expanding or becoming dangerously volatile.
Overview
Volatility Master Pro V2 classifies volatility into states such as Quiet, Normal, Squeeze, Expansion and High-risk / Exhaustion. It helps you avoid trading just as volatility dries up or spikes in an unsustainable way.
How it plots
- A volatility band or cloud showing current volatility relative to recent history.
- HUD or labels indicating the current volatility state (for example: HOT, READY, AVOID).
How to use it
- Prefer breakout trades when volatility is moving from quiet/squeeze into healthy expansion.
- Avoid opening new trades when volatility is already in an extreme state or flipping wildly.
- Combine volatility states with regime and structure tools to decide when the market deserves your risk.
Volume Surge Lite V2
Best for: Lite users who want to know when volume is actually participating in a move.
Overview
Volume Surge Lite V2 is a simple volume state indicator. It classifies volume as low, normal or elevated and highlights candles where participation is clearly higher than the recent baseline.
How it plots
- A volume pane under price with basic colour coding.
- Optional highlights on "surge" candles.
How to use it
- Use Lite as a quick yes/no on whether a breakout had above-average participation.
- Ignore tiny breakouts that occur on obviously low volume.
- Combine with sessions to focus on volume only during your preferred trading hours.
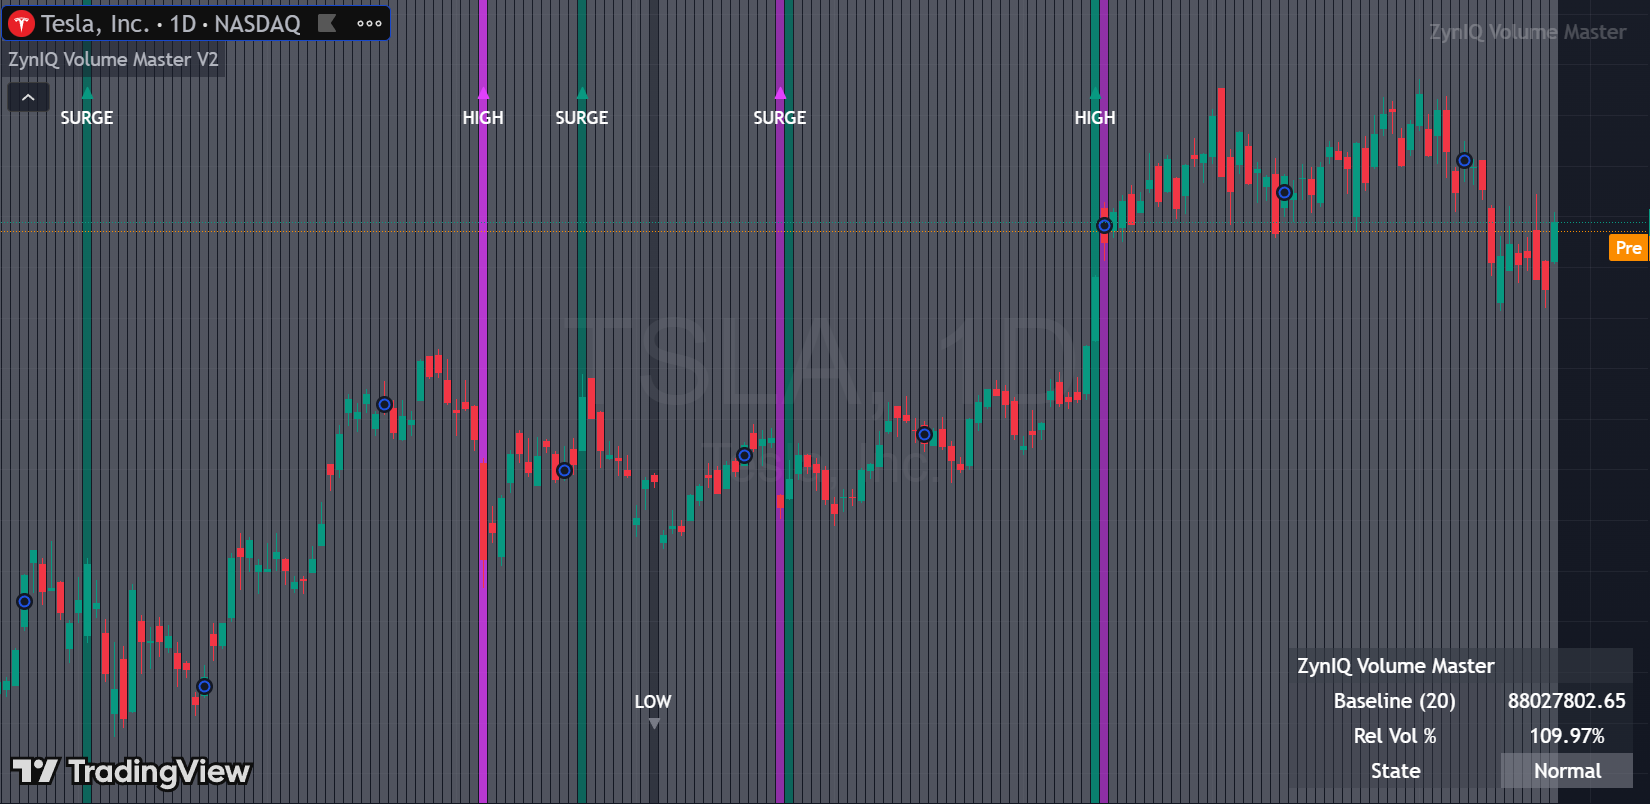
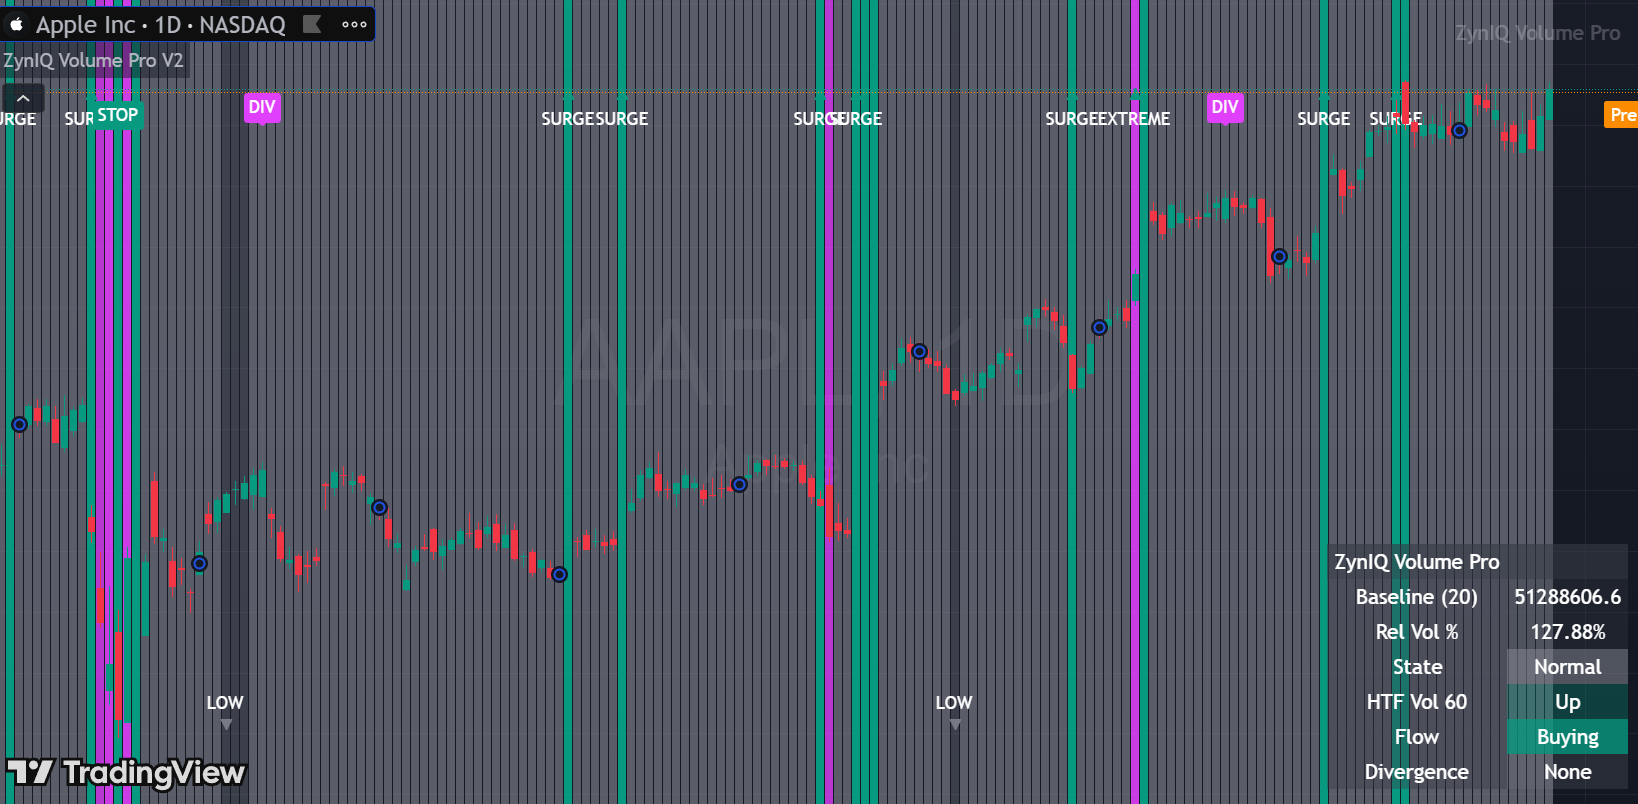
Volume Surge Pro V2
Best for: Pro and Pro Plus users who need a more nuanced read on volume quality.
Overview
Volume Surge Pro V2 extends the Lite concept with more states (for example: low, normal, surge, extreme, climax), churn detection and basic volume divergence logic. It is designed to highlight both strong sponsorship and dangerous "big volume, small range" conditions.
How it plots
- A multi-state volume pane under price.
- Markers or colours for exhaustion/climax and divergence conditions.
How to use it
- Look for strong moves where volume is in healthy "surge" states rather than extreme climax.
- Treat heavy volume with small ranges as potential churn or absorption; be cautious about chasing breakouts here.
- Use divergence signals as a warning to tighten risk, not as automatic reversal triggers.
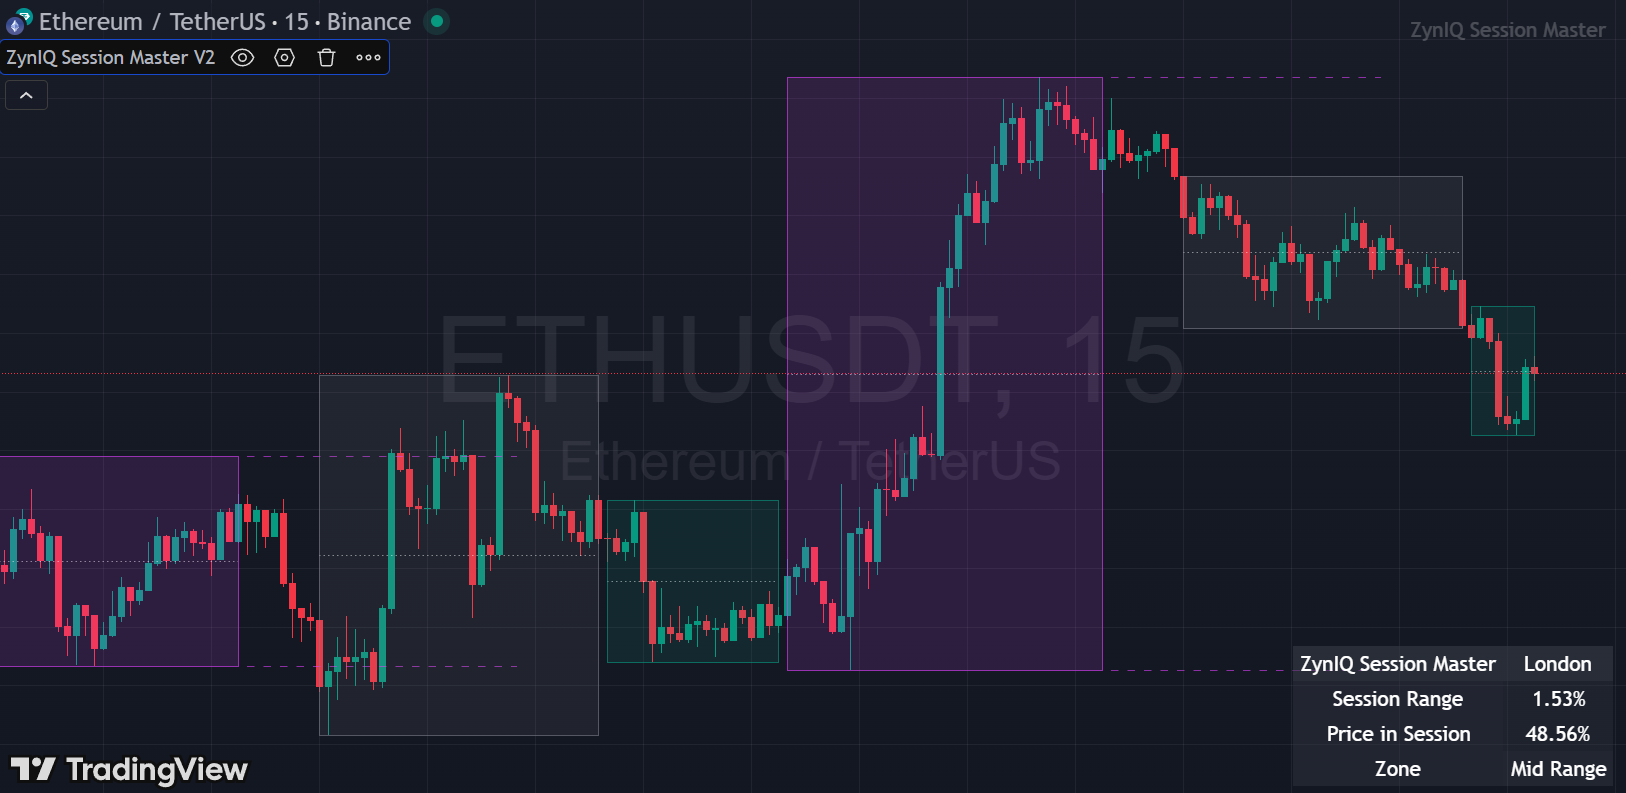
Session Master V2
Best for: any intraday trader who cares about Asia, London and New York session behaviour.
Overview
Session Master V2 marks major trading sessions on your chart. It helps you see when the market is likely to be most active, when liquidity typically improves, and when you are trading in quieter off-hours.
How it plots
- Coloured background bands for key sessions (for example: Asia, London, New York).
- Optional labels for session highs/lows.
How to use it
- Avoid judging the quality of a breakout that occurs in a consistently dead session.
- Focus your active trading on the sessions where your pair or asset usually has real volume.
- Use session highs/lows as additional context together with structure and liquidity tools.
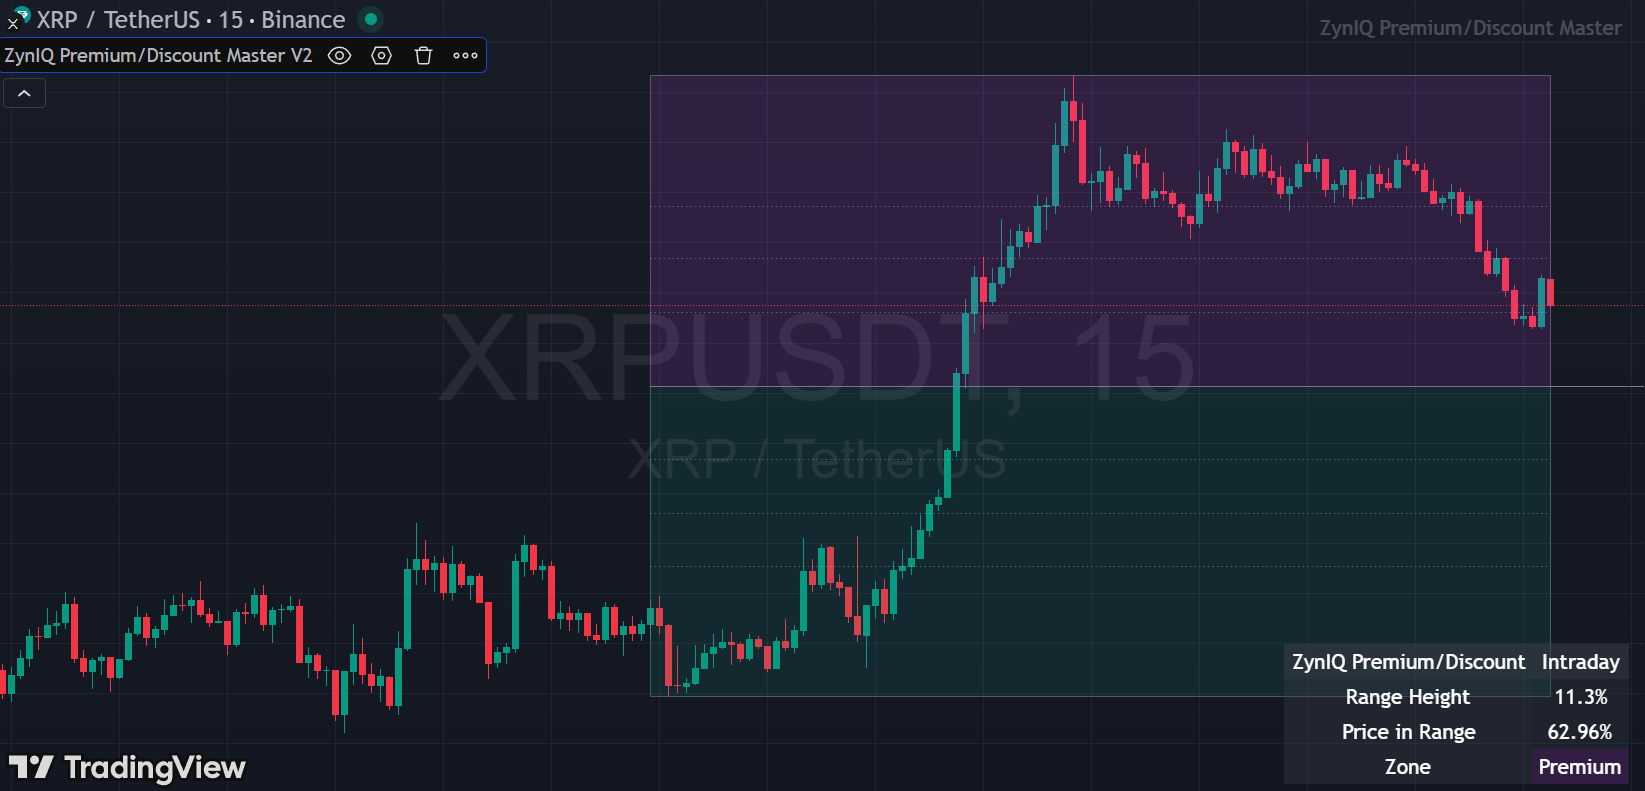
Premium / Discount Master V2
Best for: traders who like to frame entries around fair value, premium and discount zones.
Overview
Premium / Discount Master V2 plots an equilibrium (EQ) line and shows where price is trading in premium (above) or discount (below). This helps you avoid chasing longs deep into premium or shorts deep into discount.
How it plots
- A midline or EQ level across your visible lookback.
- Shading or labels indicating premium vs discount zones.
How to use it
- Bias your longs towards discount zones when the broader trend supports buying.
- Bias your shorts towards premium zones when the broader trend supports selling.
- Combine with structure and liquidity tools to avoid blindly fading strong trends.
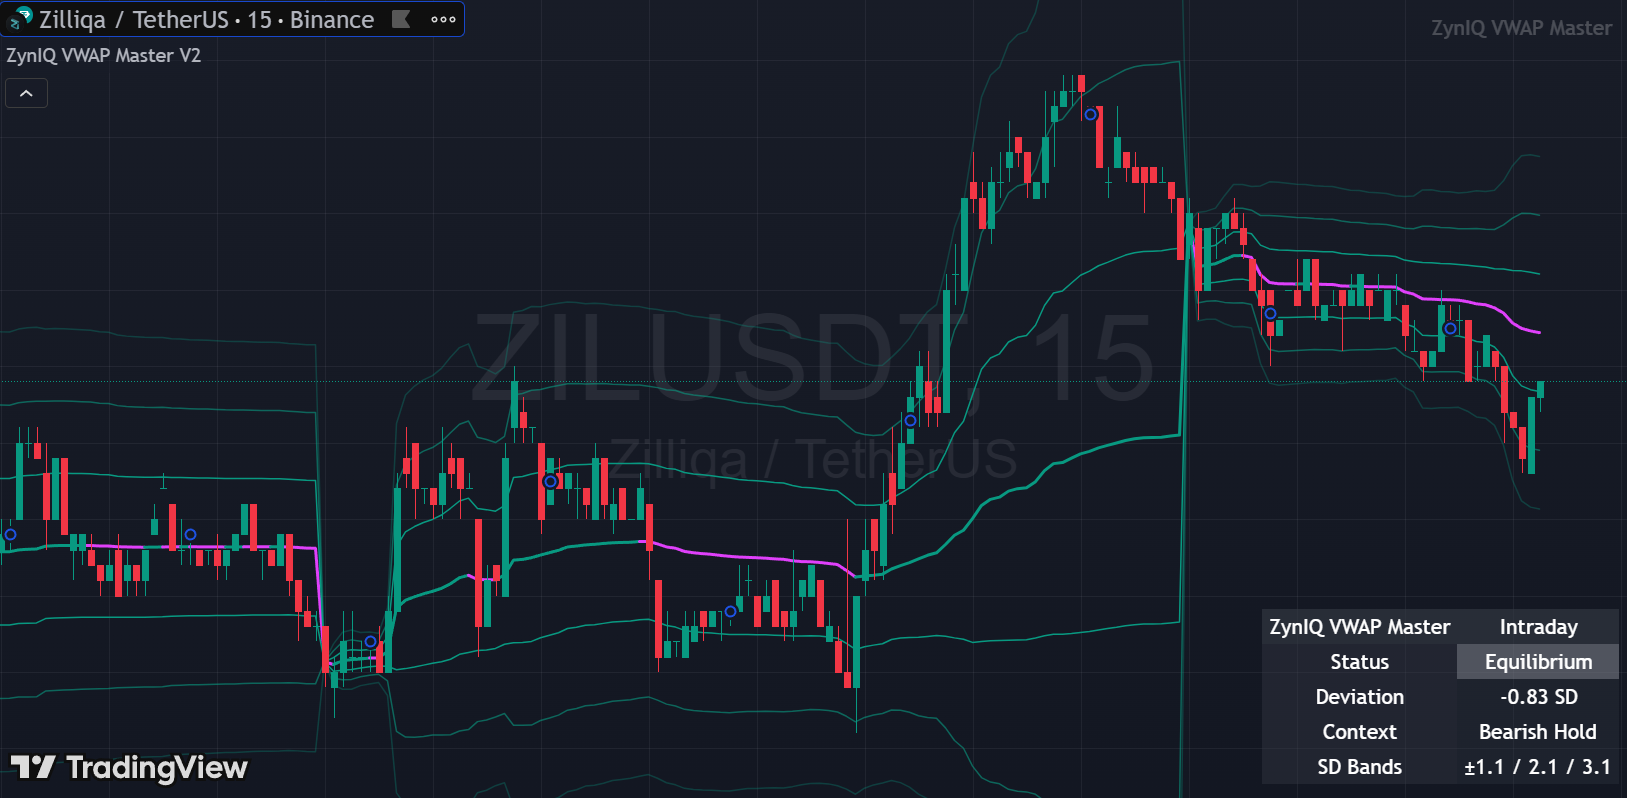
VWAP Master V2
Best for: intraday traders who care about volume-weighted fair value.
Overview
VWAP Master V2 plots a session or rolling VWAP along with optional bands. It provides a reference for where the bulk of traded volume has occurred and whether price is currently stretched relative to that value area.
How it plots
- A main VWAP line following price.
- Optional upper and lower bands or zones around VWAP.
How to use it
- Use VWAP as a reference point for mean-reversion vs continuation decisions.
- When price is far from VWAP and volatility is high, be cautious about initiating new positions.
- Combine VWAP with sessions and volume to understand when moves are likely to be sustained.
Putting risk & utility tools together
Risk and utility tools are not there to generate standalone signals. Their job is to make sense of what your breakout, regime and structure tools are already telling you.
- Use Risk Helper to turn ideas into concrete trade plans.
- Use volatility and volume tools to decide whether the market currently deserves your risk.
- Use sessions, premium/discount and VWAP to place trades in the "good" parts of the day and structure.
Indicators FAQ
Do ZynIQ indicators repaint?
No. ZynIQ indicators do not repaint once a candle has closed. Values may move while the candle is forming, but all levels lock in at candle close.
Which timeframes work best?
ZynIQ indicators function on all timeframes, but most traders prefer 15m, 1h, 4h and 1D for clearer structure. Very low timeframes can be noisier.
Are indicators the same as the ZynIQ bot?
No. Indicators show market structure and context, while the bot uses deeper logic including safety layers, volatility and risk scoring, intrabar behaviour and self-learning.
Can I trade directly from indicator signals?
You can trade manually using the structure and context ZynIQ provides, but indicators are not meant to be a “buy/sell arrow” system. They are a framework for structured decision-making.
Do indicators guarantee profitability?
No indicator or tool can guarantee profits. ZynIQ aims to provide clarity, structure and consistency, but users remain responsible for risk and execution.
Can I use ZynIQ indicators on any asset?
Yes. Most TradingView assets are supported (crypto, FX, indices, commodities, some stocks). Deepest testing has been in crypto and liquid markets.
What’s the difference between Essentials, Lite, Pro and Pro Plus?
Essentials offers the core breakout engine with the Risk Helper. Lite adds sessions, premium/discount, VWAP, volume and momentum context tools. Pro adds advanced structure, liquidity, FVG, trend and Pro‑level volume tools on top of Lite. Pro Plus unlocks Regime Master Pro, Volatility Master Pro, the Core Pro Suite and Order Block Master for full environment trading.
Bot concepts
Core philosophy
The ZynIQ bot is built around a simple idea: stability first, intelligence second. It is not a single “signal indicator with auto-clicking”; it is a full decision engine that combines structure, regime, volatility and risk into a controlled, self-learning process.
Signals, filters and scores
The bot does not rely on a single entry rule. It thinks in layers:
- Signal layer – finds potential opportunities such as breakouts, volatility shifts or context events. These are candidates, not automatic trades.
- Filter layer – applies safety checks: regime quality, trend and volatility conditions, symbol behaviour, risk limits and other guardrails.
- Scoring layer – assigns an internal score to each candidate based on structure quality, regime alignment, volatility suitability and recent performance in similar conditions.
A trade only proceeds if it passes the filters and reaches sufficient internal score.
Risk and volatility awareness
Risk is not treated as a fixed number. The bot monitors volatility regimes, stretch/extension, ATR movement, symbol-specific behaviour and portfolio-wide exposure. From this it decides whether the environment is safe, how aggressive or conservative to be, or whether to stand aside completely.
Demo UI vs connected trading
The ZynIQ demo UI is an interactive sandbox that lets you explore how the dashboard looks and feels. It uses simulated and scripted data to demonstrate:
- How bots are listed and managed
- How open and closed trades are displayed
- How PnL, equity and performance views are presented
- How status, health and logs are surfaced in the interface
The demo UI does not reflect live trades from your own bot or account. It is a safe environment to explore the workflow and behaviour patterns without connecting an exchange or risking capital.
When you connect a real account, the same style of dashboard is used, but the data then comes from your actual bot activity and exchange connection instead of simulated streams.
Relationship to indicators
ZynIQ indicators and the ZynIQ bot are related but not identical:
- Indicators show structure, breakouts, regimes, ATR and context on TradingView charts.
- The bot uses its own internal view of structure and context, adds safety layers, scoring, symbol-specific memory and self-learning, then executes trades according to its rules.
You can think of indicators as the visual language, and the bot as the execution engine that speaks that language with additional intelligence behind the scenes.
What the bot is not
- It is not a “get rich quick” machine.
- It is not a simple green-arrow/red-arrow auto-clicker.
- It is not a system that expects you to constantly retune raw formulas.
The design goal is a controlled, self-learning engine with transparent behaviour, minimal required configuration and a focus on risk and stability.
Where the bot fits in the ZynIQ stack
The ZynIQ bot sits at the centre of the ecosystem:
- Indicators teach and visualise structure, context and volatility.
- The bot makes decisions and executes trades based on a multi-layer engine.
- The dashboard shows you what the bot is doing and gives you control over which bots run, how they manage risk and which accounts they use.
Once you understand the indicators and have spent time in the demo dashboard, you are effectively thinking in the same language as the ZynIQ bot.
Dashboard tour
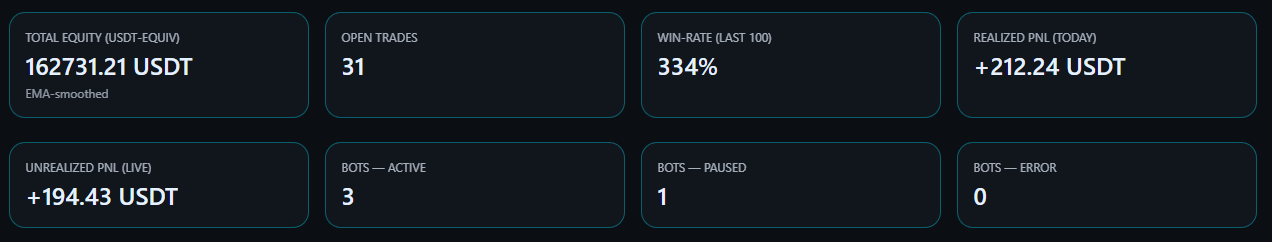
Overview screen
The Overview page is your high-level status view. It shows equity, active bots, recent performance and key health information in one place.
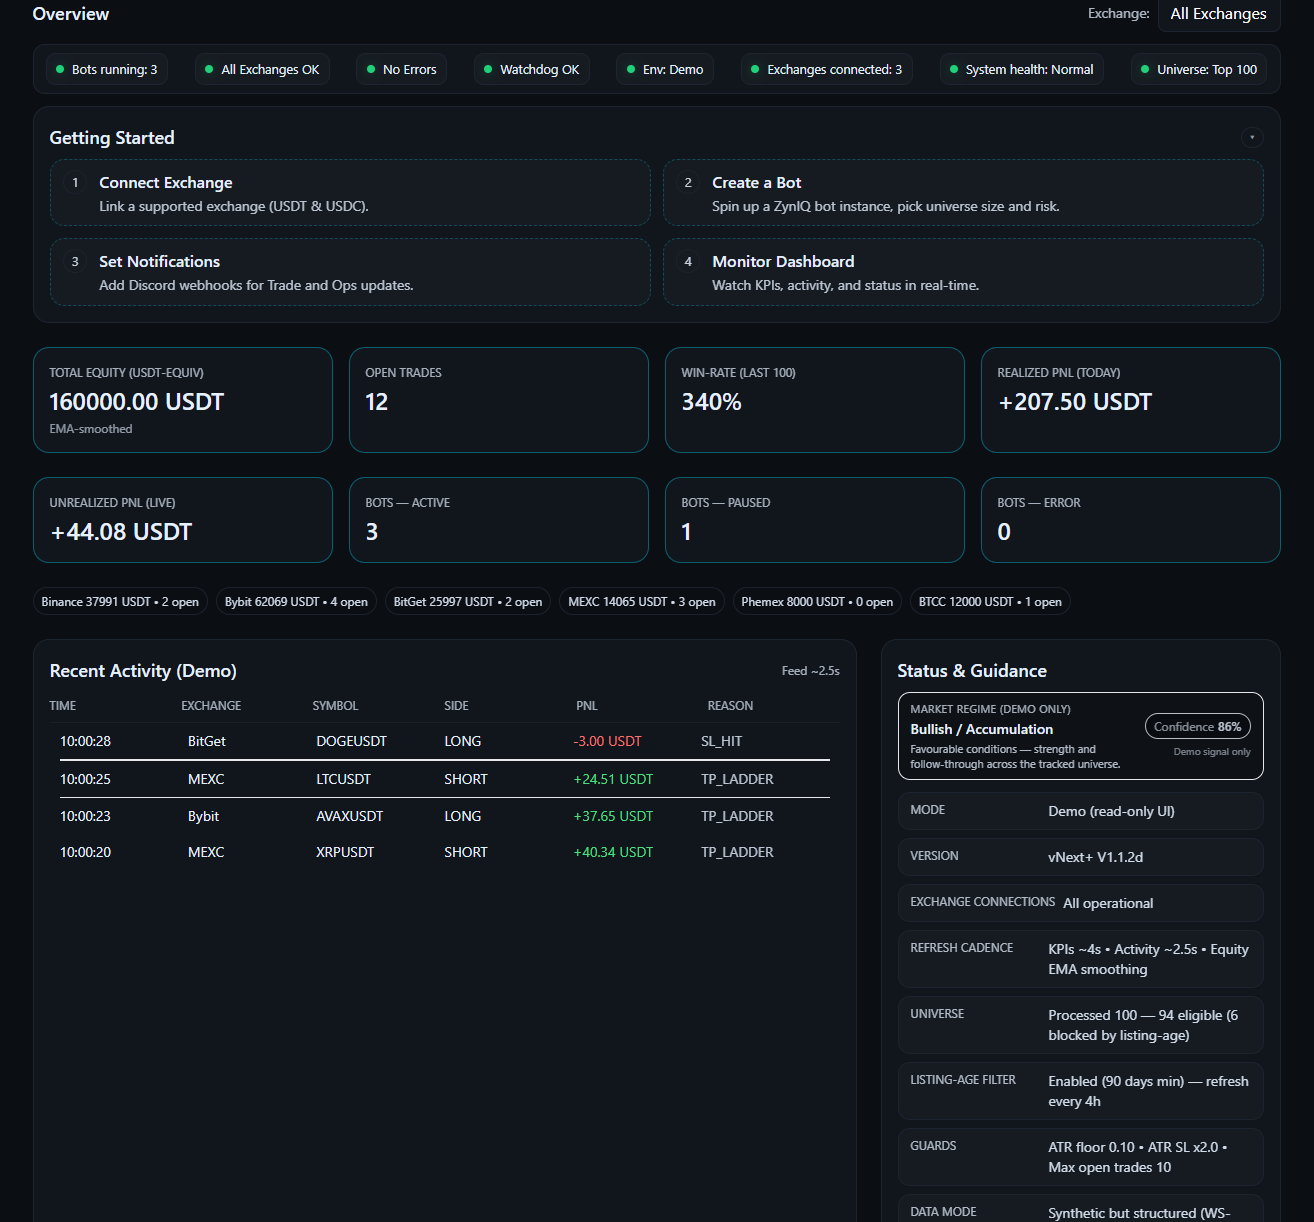
- Total equity and high-level PnL snapshot
- Number of active bots and open trades
- Market snapshots and basic context
- Recent activity feed and status messages
Bots list
The Bots page shows all available bots, their state and where they are connected.
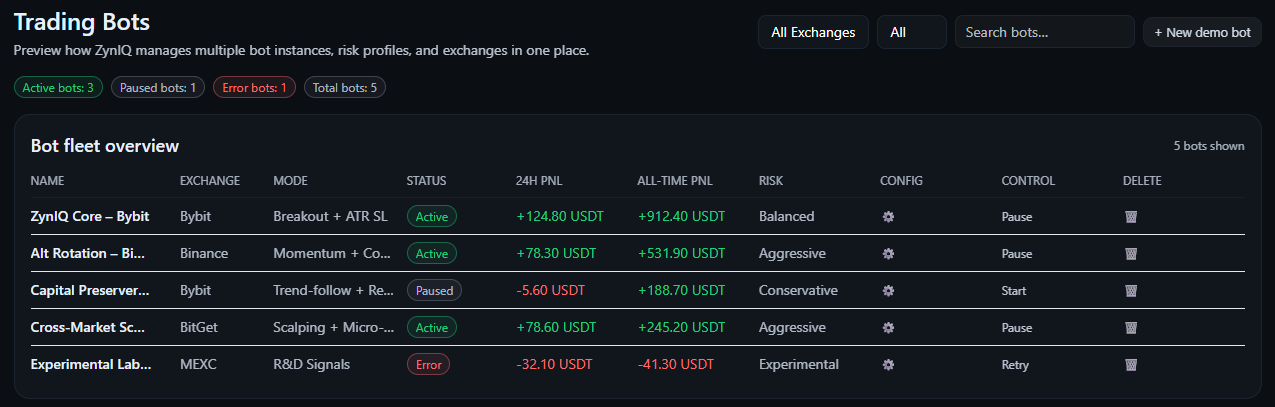
- Bot name and description
- Status (running, paused, idle)
- Exchange assignment and connection state
- Current risk profile and open trades count
- Recent performance indicators
Open trades
The Open trades view displays every active position the system is tracking.
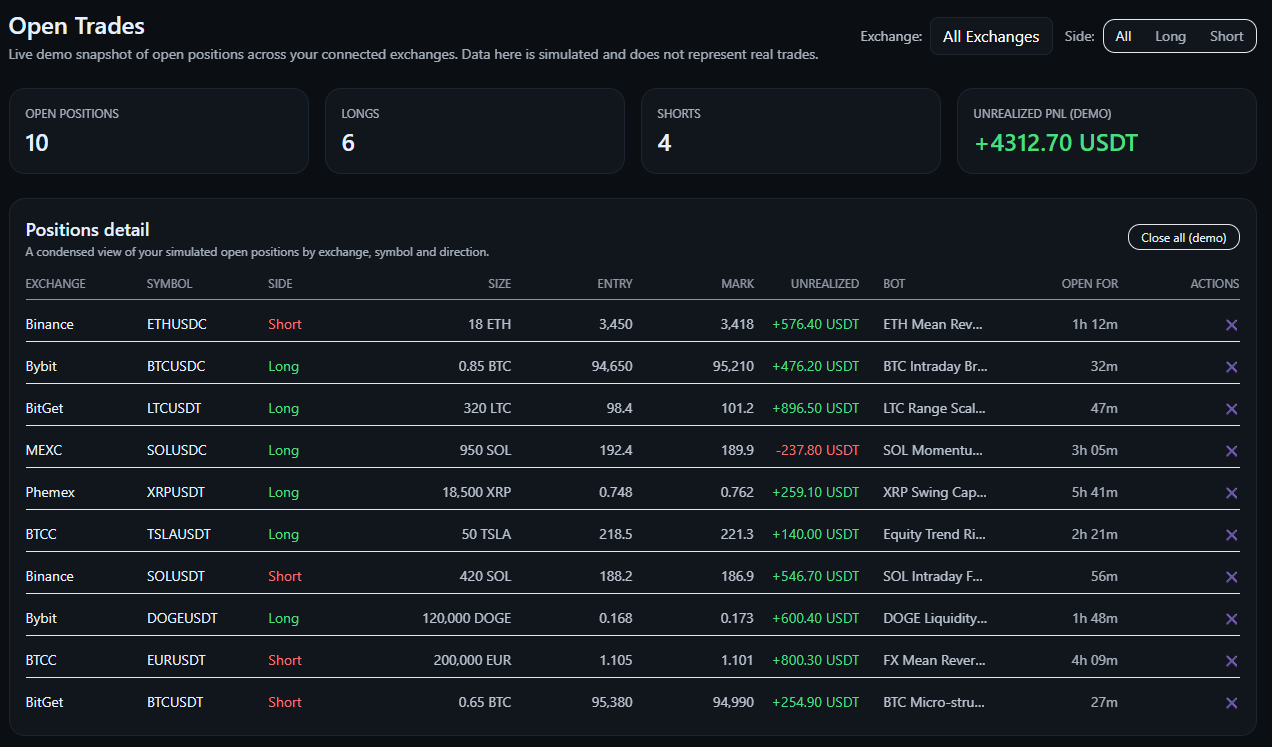
- Symbol, side and position size
- Entry price, SL/TP and current price
- Unrealized PnL
- Trade age and basic context
Closed trades & PnL reporting
The PnL reporting area focuses on results over time.
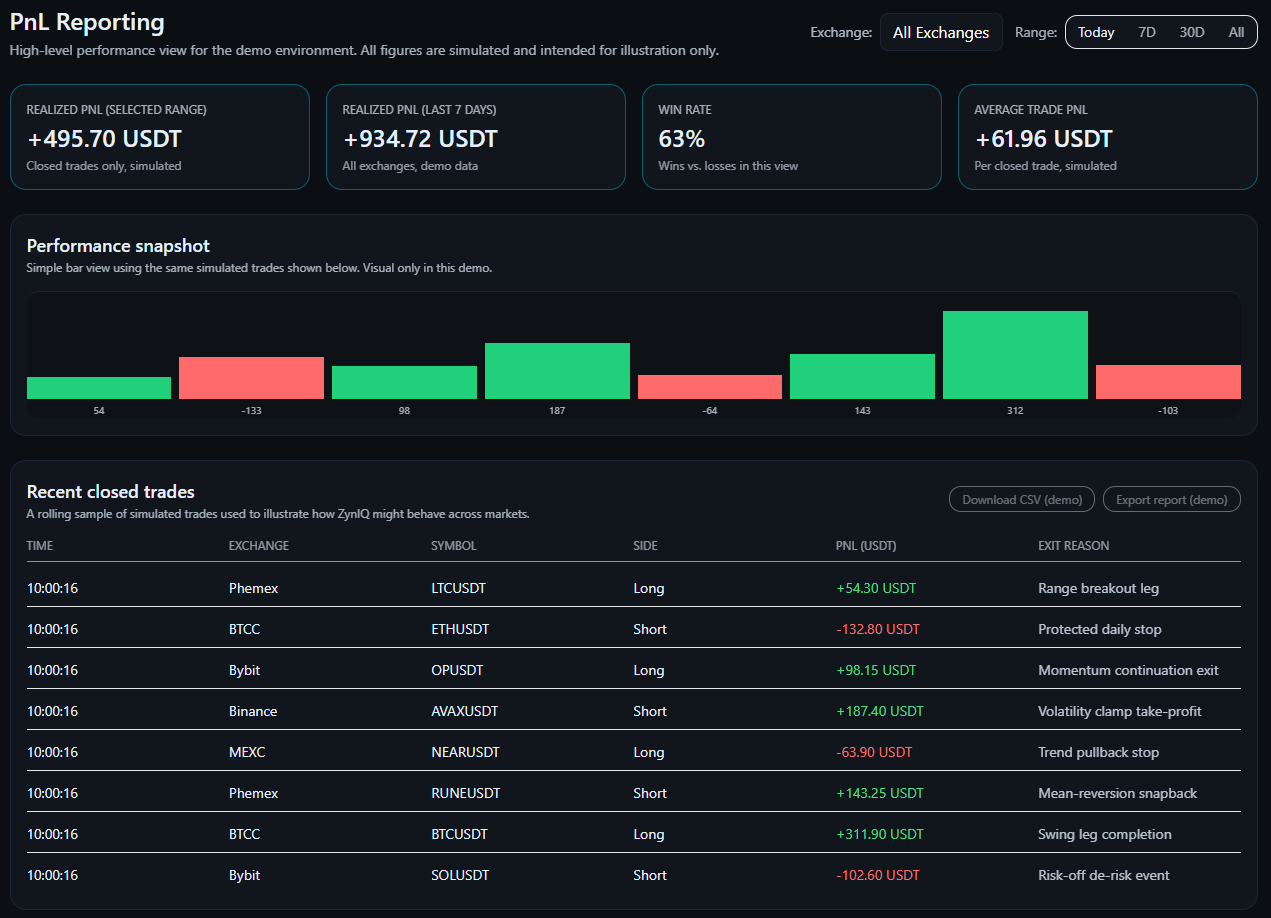
- Recently closed trades with outcomes
- Equity curve visualisation
- Win/loss breakdown and basic ratios
- Period filters (daily, weekly, monthly)
Logs & activity
The Logs view provides transparency around what the system is doing.
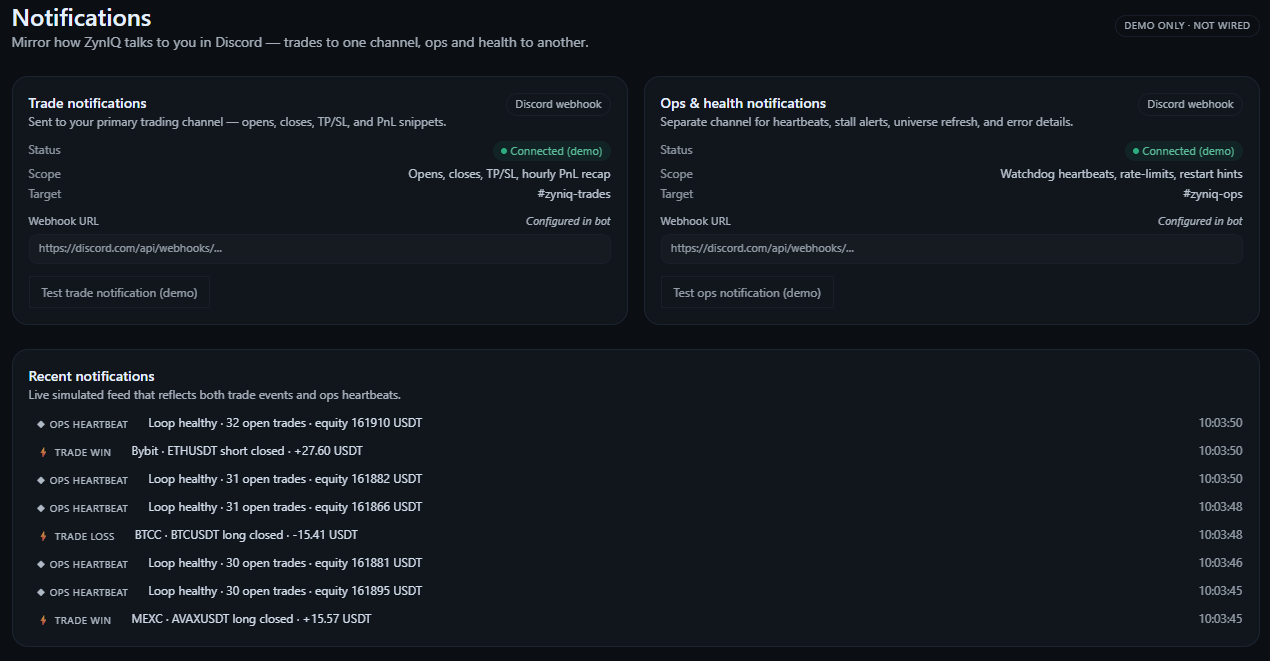
- Trade lifecycle events
- Execution updates
- Risk and safety decisions
- Skipped trades with reasons
- System health and connection notes
Configuring bots
Configuration philosophy
ZynIQ bot configuration is designed to be simple. You control risk, symbols and preferences, not raw formulas or technical internals.
Core configuration areas
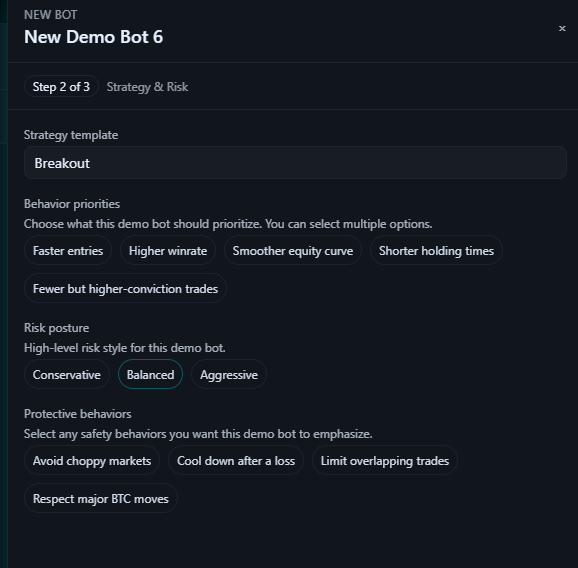
- Risk profile – define whether the bot behaves conservatively, in a balanced way or more aggressively within its safety limits.
- Exchange connection – choose which exchange/account a bot is allowed to trade on, or keep it safely disconnected.
- Symbols – select which markets the bot can operate on; the engine still applies its own volume and stability checks.
- Max exposure – limit overall exposure, maximum open trades and concentration per symbol.
- Bot status – start, pause or fully disable a bot with immediate effect.
No JSON, no servers, no coding
All configuration is handled inside the ZynIQ dashboard. There are no config files to edit, no scripts to restart and no VPS maintenance to manage.
How changes affect behaviour
Configuration guides the bot but does not override safety. For example:
- Expanding the symbol list increases opportunity, but the bot still filters aggressively.
- An aggressive risk profile raises allowed sizing but does not force reckless trades.
- Lowering max exposure reduces risk and open trades, but the engine remains stable and systematic.
- Pausing a bot typically halts new entries while allowing existing trades to be managed or closed correctly.
Demo mode
What demo mode is
Demo mode is a fully interactive sandbox that lets you experience the ZynIQ dashboard without connecting an exchange or risking capital.
What you see in demo mode
- Simulated equity curves and performance history
- Generated open and closed trades
- Market snapshot and context panels
- Activity feeds and log-style messages
What demo mode is not
- It does not display trades from your real account.
- It does not execute any live orders.
- It does not mirror actual market performance.
Why demo mode exists
Demo mode helps you learn the layout, terminology and workflow of the ZynIQ dashboard before connecting live capital. Everything you practice in demo mode maps directly to how the live dashboard behaves.
Bot FAQ
Do I need coding or a VPS to run the bot?
No. The bot is managed entirely through the ZynIQ dashboard. There is no need for coding, servers, VPS hosting or manual scripts.
Does the bot use my TradingView indicators directly?
No. TradingView indicators help you understand market structure, but the bot uses its own internal engine, regime logic, scoring and self-learning behaviour.
Can the bot lose money?
Yes. All trading involves risk. ZynIQ focuses on stability, risk control and long-term consistency, but losses are a normal part of any real trading system.
Can I override the bot's entries manually?
You can pause or disable a bot at any time, but you cannot force trades into the engine. This prevents overriding its safety and stability rules.
Does the bot trade 24/7?
Yes. As long as a bot is running and connected to an exchange, it monitors conditions continuously and acts according to its internal logic.
How much setup is required?
Setup is minimal. You select the exchange, symbols, risk profile and exposure limits. The bot handles the technical details and execution.
Can multiple bots run at the same time?
Yes. You can run multiple bot profiles simultaneously, each with its own configuration and exchange connection.
How do I see why the bot skipped a trade?
The Logs or activity views record skipped trades along with their reasons, such as poor regime, unfavourable volatility, stretch, risk limits or low internal score.
What happens if my exchange connection is interrupted?
The bot pauses trading when an exchange connection is lost and resumes only when it is safely restored.
Does the bot scale position sizes as my account grows?
Yes. Position sizing adapts according to your configured risk profile and exposure settings so that behaviour scales with your account.
Licensing
Account identity
ZynIQ licensing is based on your ZynIQ account email and, for TradingView indicators, your TradingView username. These identifiers keep access simple and secure.
Indicator licensing (TradingView)
Indicators are delivered through TradingView as invite-only scripts.
- You choose an indicator plan on the ZynIQ website.
- During checkout, you provide your TradingView username.
- Your username is granted access to the relevant scripts.
- The indicators appear under Invite-Only Scripts inside TradingView.
If you change your TradingView username in future, you can request an update via support with proof of ownership.
Bot and dashboard licensing
Bot access is tied to your ZynIQ account. Plans can control for example:
- How many bots you can run at once.
- How many exchanges or accounts you can connect.
- Which dashboard features are available.
Subscription model
ZynIQ operates on a subscription basis. As long as your subscription is active:
- Indicator access on TradingView remains enabled.
- Dashboard and bot access remain active according to your plan.
If a subscription expires or is cancelled, access may be paused until it is reactivated.
Upgrades and downgrades
You can move between plans. Upgrades typically unlock more indicators, bots or features immediately. Downgrades usually take effect at the end of your current billing period, subject to the terms shown at checkout.
Security and API keys
When connecting an exchange, you supply API keys from your exchange account into the ZynIQ dashboard. ZynIQ never asks for withdrawal permissions. You remain in control of your funds at the exchange at all times.
Support
If you ever lose access, change platform accounts or believe there is a licensing error, you can contact support with your ZynIQ email address and TradingView username so the team can resolve it.
Early access
What early access is
Early access gives a limited group of users the ability to use new ZynIQ components before they are widely released. It is intended for traders who are comfortable providing feedback and understand that early features can evolve quickly.
What you can expect
- Access to new bot behaviour, dashboard features or indicator updates ahead of general release.
- Occasional changes to layouts, wording and options as features are refined.
- Direct channels to share feedback, suggestions and bug reports.
How to join
You can join the early access programme by registering your interest through the ZynIQ website. Spaces may be limited to keep feedback manageable.
Responsibilities of early access users
- Use early access features with the understanding that behaviour may change as improvements are made.
- Report issues or unexpected behaviour where possible.
- Follow published risk guidance when connecting real accounts.
Moving from early access to general release
As features mature, they are promoted to general availability. In most cases this is seamless: you continue using the updated feature without interruption, although some options or layouts may adjust based on feedback collected during early access.
Version history
How versioning works
ZynIQ tracks versions separately for indicators, the bot engine and the dashboard. This lets you see which parts of the stack have changed and when.
Typical structure
- Indicators – changes to TradingView scripts such as new tools, improvements, visual refinements and performance updates.
- Bot – updates to internal logic, safety, self-learning behaviour and exchange connectivity.
- Dashboard – UI changes, new views, UX polish and operational improvements.
Release notes overview
Each release is documented with a short summary of:
- What changed.
- Why it changed.
- Any important notes for users.
Example layout
The live version history page generally includes entries similar to:
- Indicators vX.Y – added or updated specific tools, improved visuals, refined alerts.
- Bot vX.Y – enhanced safety layers, refined internal scoring, improved exchange stability.
- Dashboard vX.Y – new components or pages, refinements to existing views, usability improvements.
[TABLE: version_history_placeholder — to be populated with concrete releases later.]
Roadmap
Roadmap philosophy
The roadmap is designed to be transparent but realistic. It focuses on stability, clarity and user experience first, then deeper intelligence over time.
Focus areas
- Indicators – expanding and refining TradingView tools while keeping charts clean and readable.
- Bot – strengthening safety, execution reliability and self-learning behaviour.
- Dashboard – improving visualisation, workflows and observability for users.
Near-term themes
- Additional indicator refinements and new utility tools.
- Deeper performance reporting and analytics in the dashboard.
- Further improvements to bot risk handling and transparency.
Mid-term themes
- More advanced context layers feeding into the bot engine.
- Richer portfolio and multi-exchange views inside the dashboard.
- Enhanced automation around monitoring and health alerts.
Longer-term direction
- More adaptive, self-learning behaviour across markets.
- Increased use of structured context for risk-aware automation.
- Deeper integration between on-chart tools and automated execution.
The roadmap is updated over time as features are delivered and new priorities emerge. It is intended as guidance, not a promise of specific dates.